Museums & Collections
I bring information design to museums, reimagining charts, maps, and data visualizations to spotlight pressing issues on the gallery floor and unlock new ways to explore collections and artists.
Museum Collection Explorer
Interactive Dashboard
▿
Ministère de la Culture, Luxembourg 2026
Role: Developer
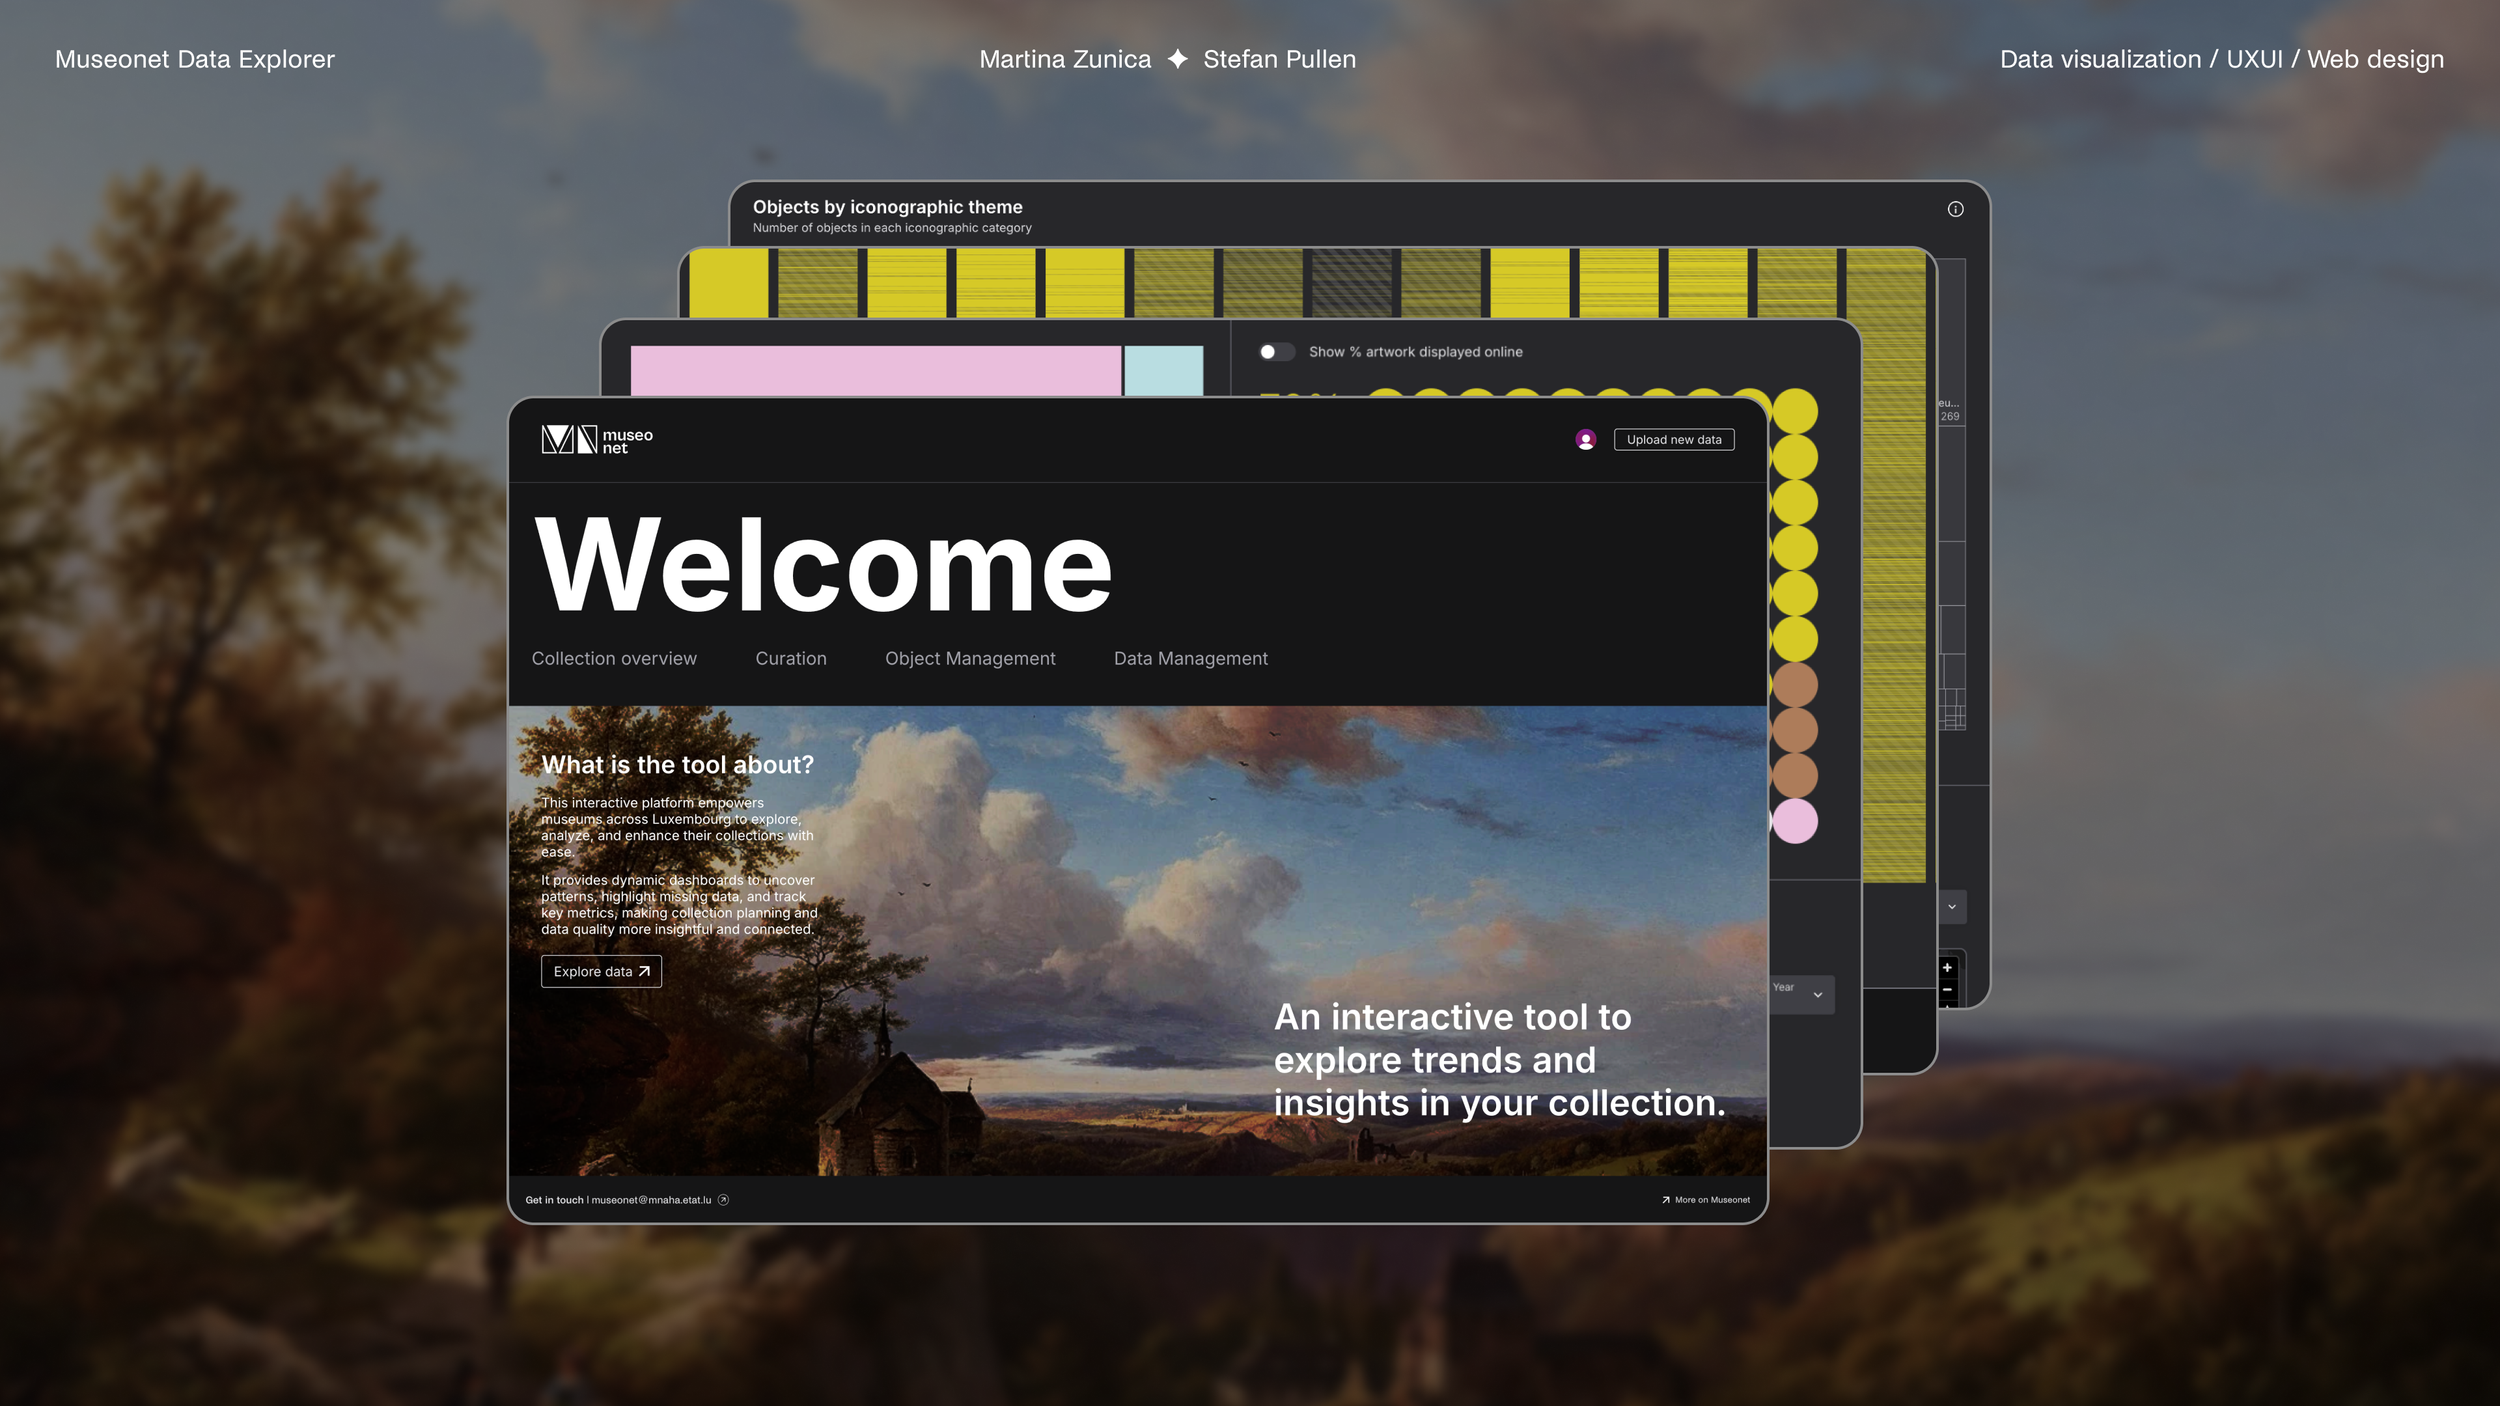
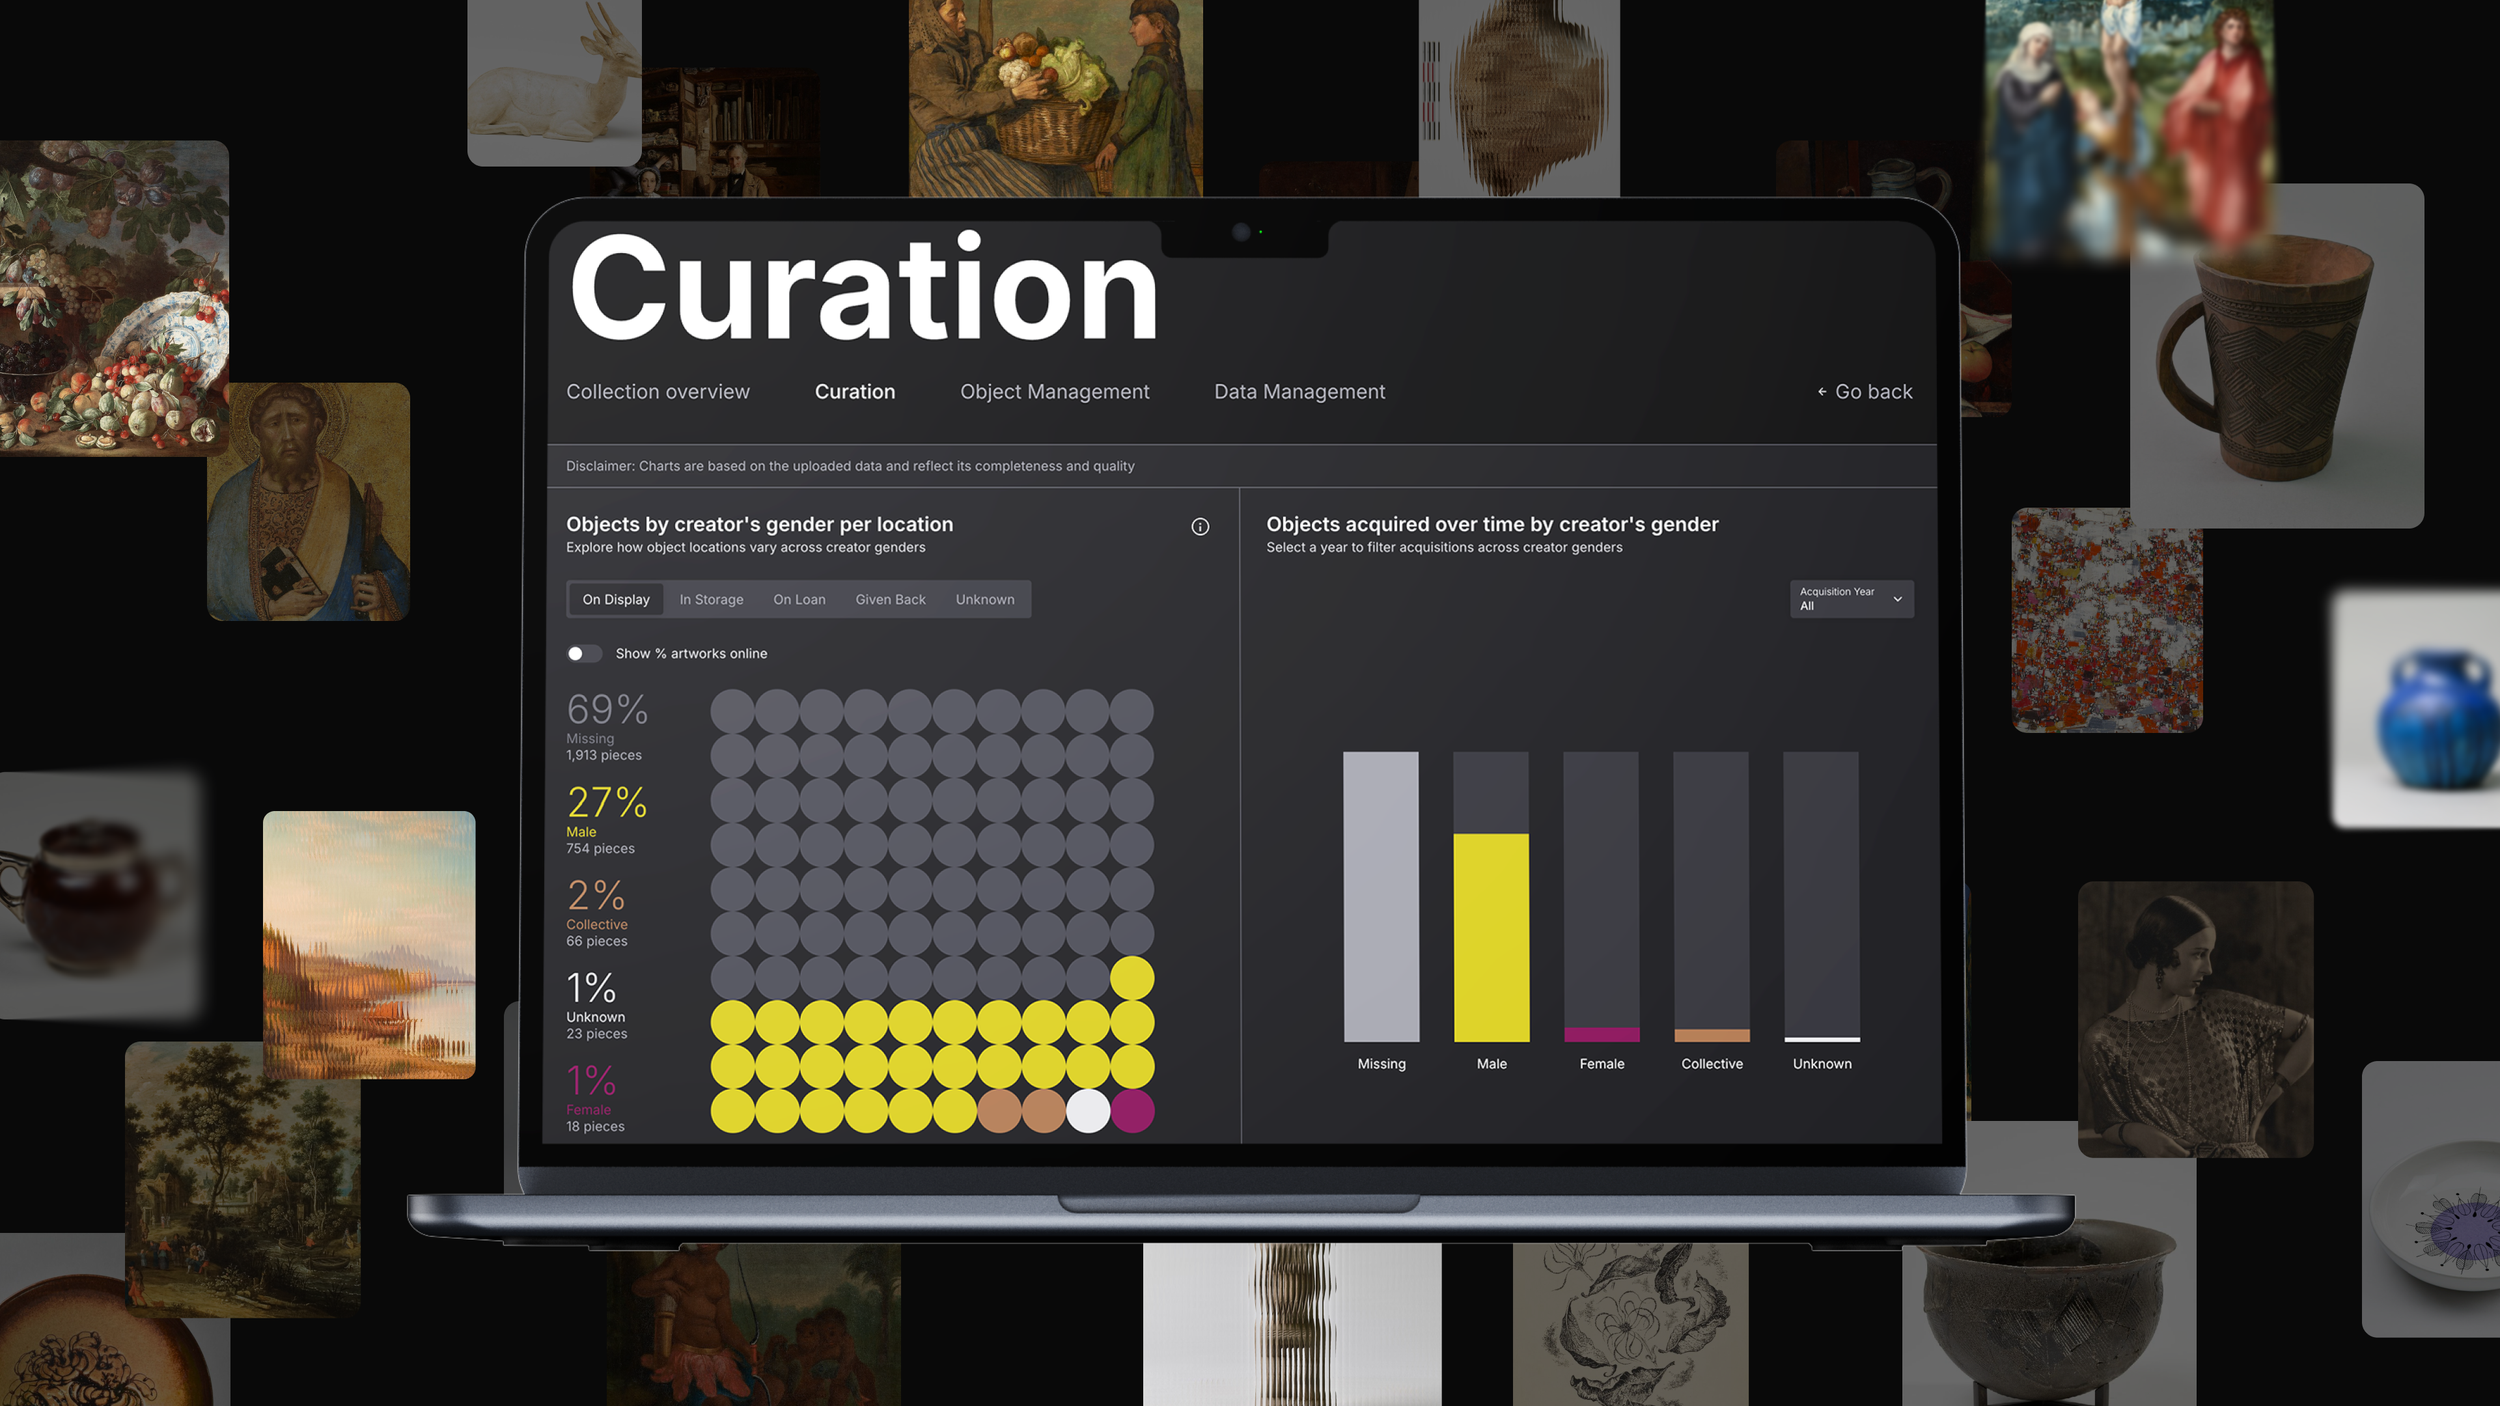
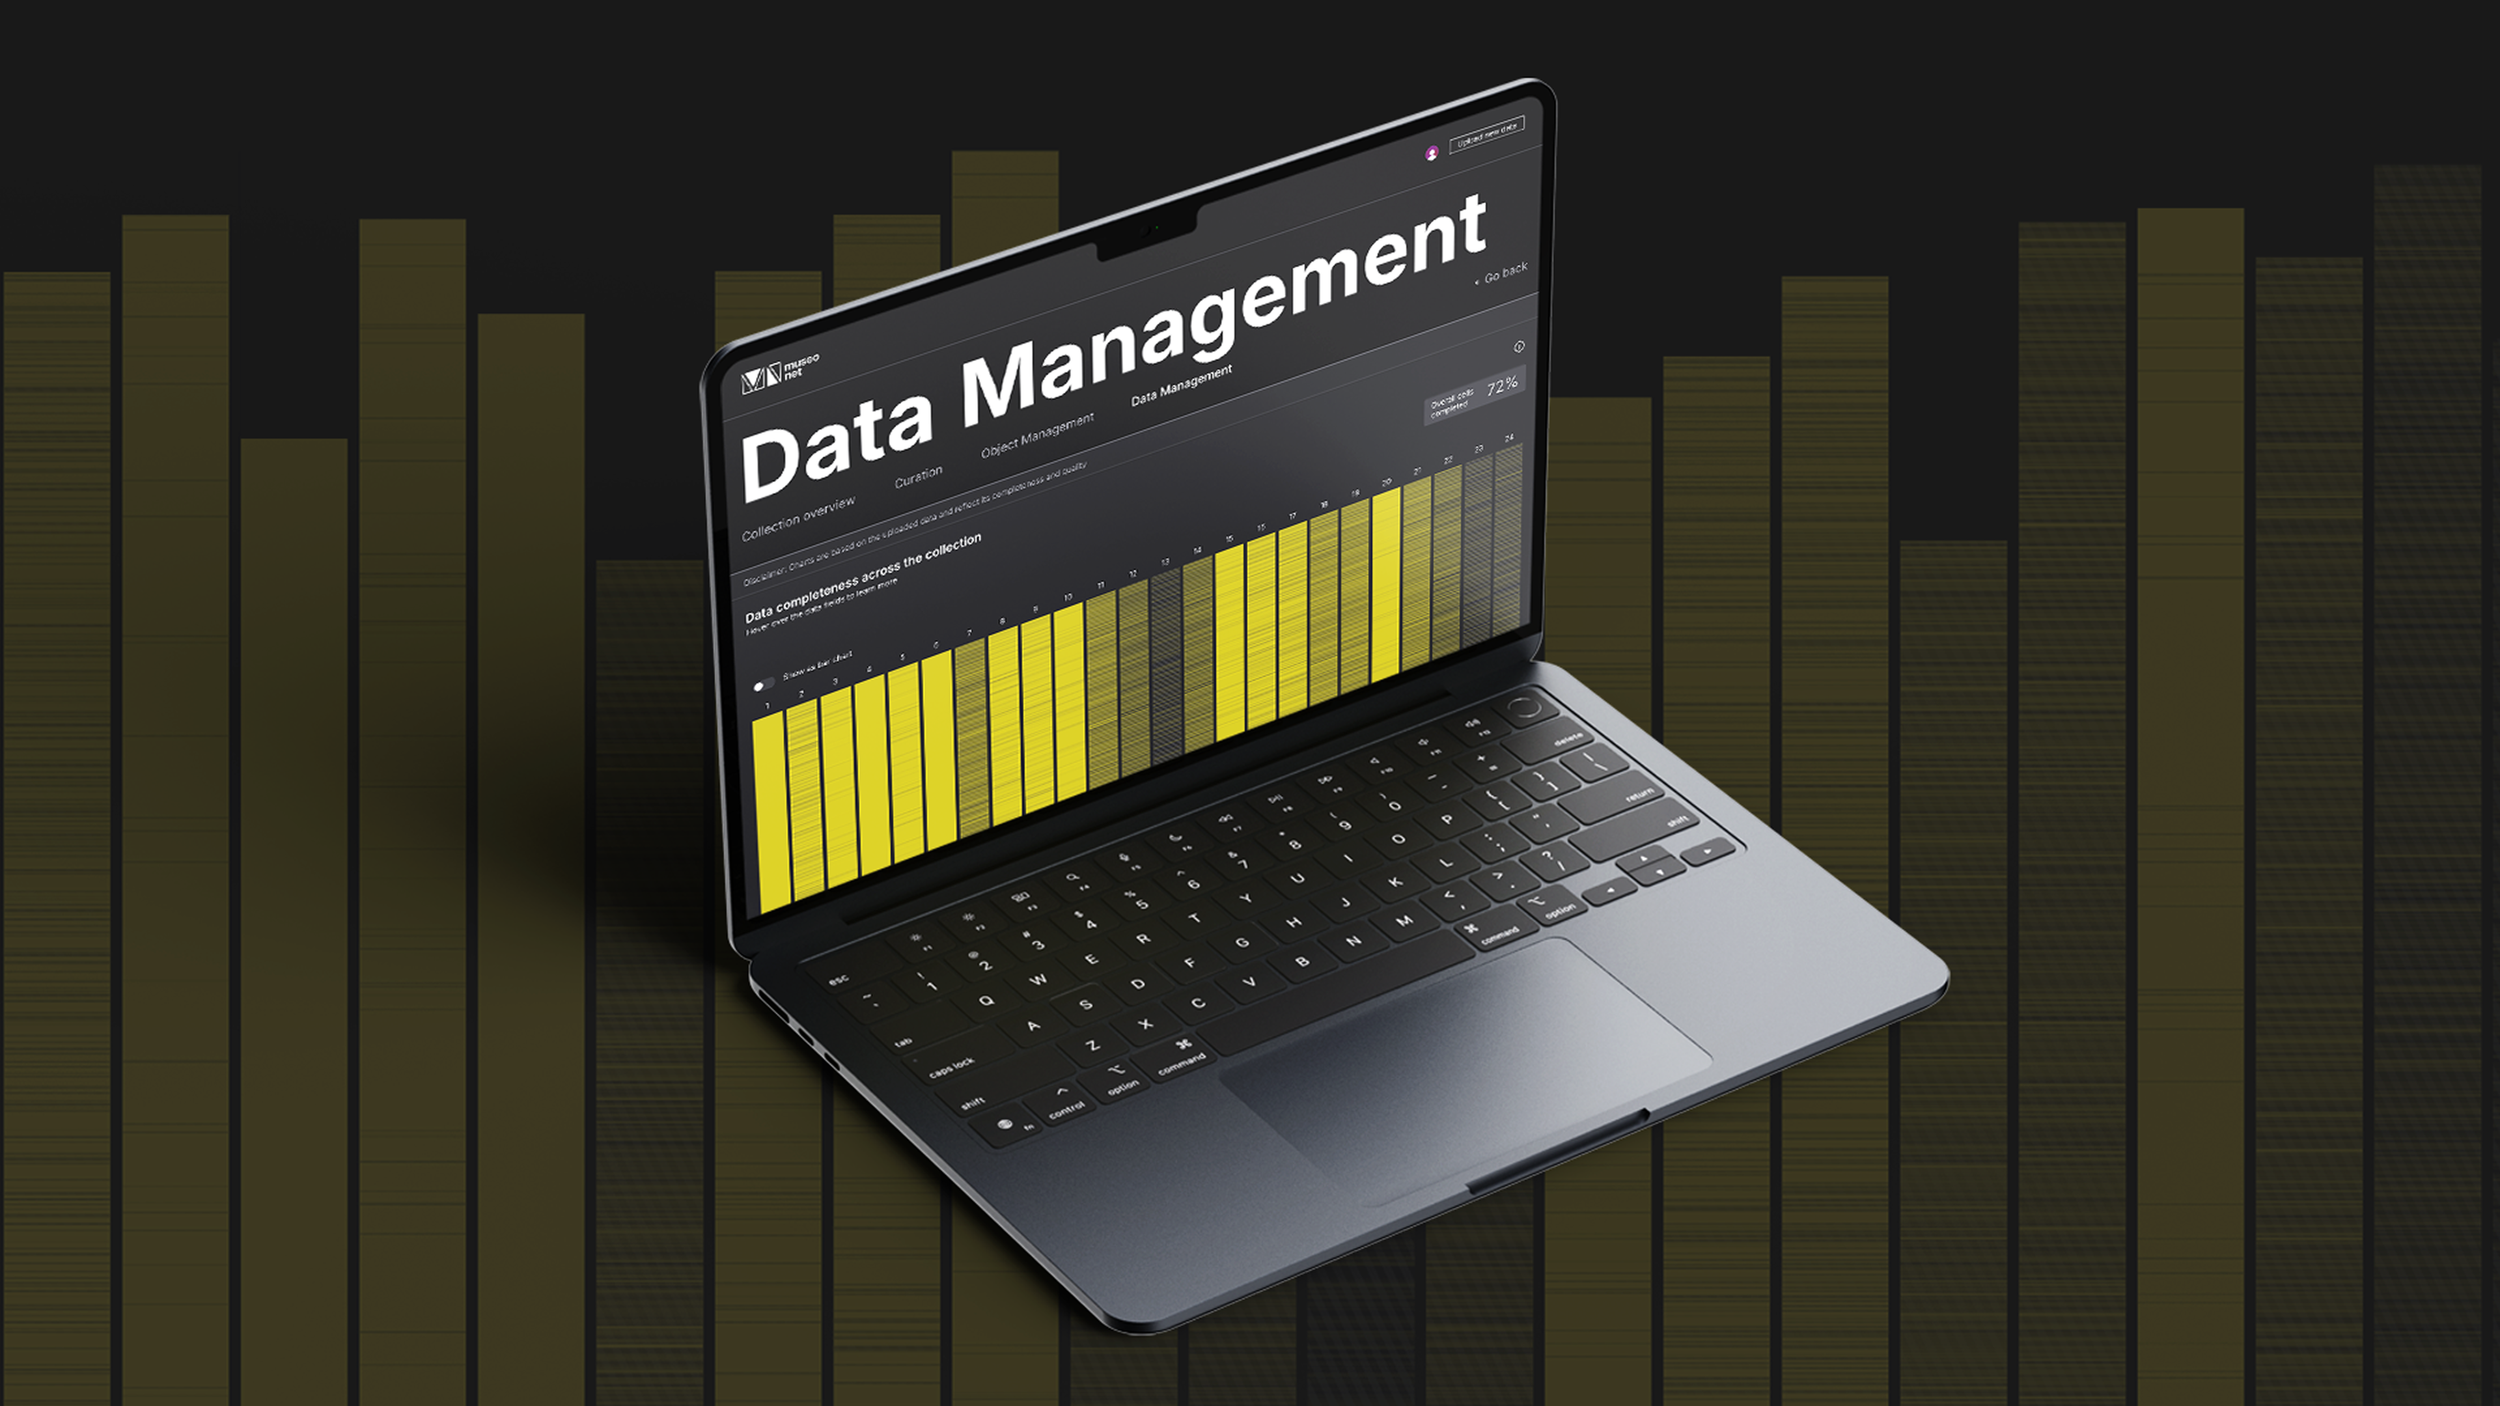
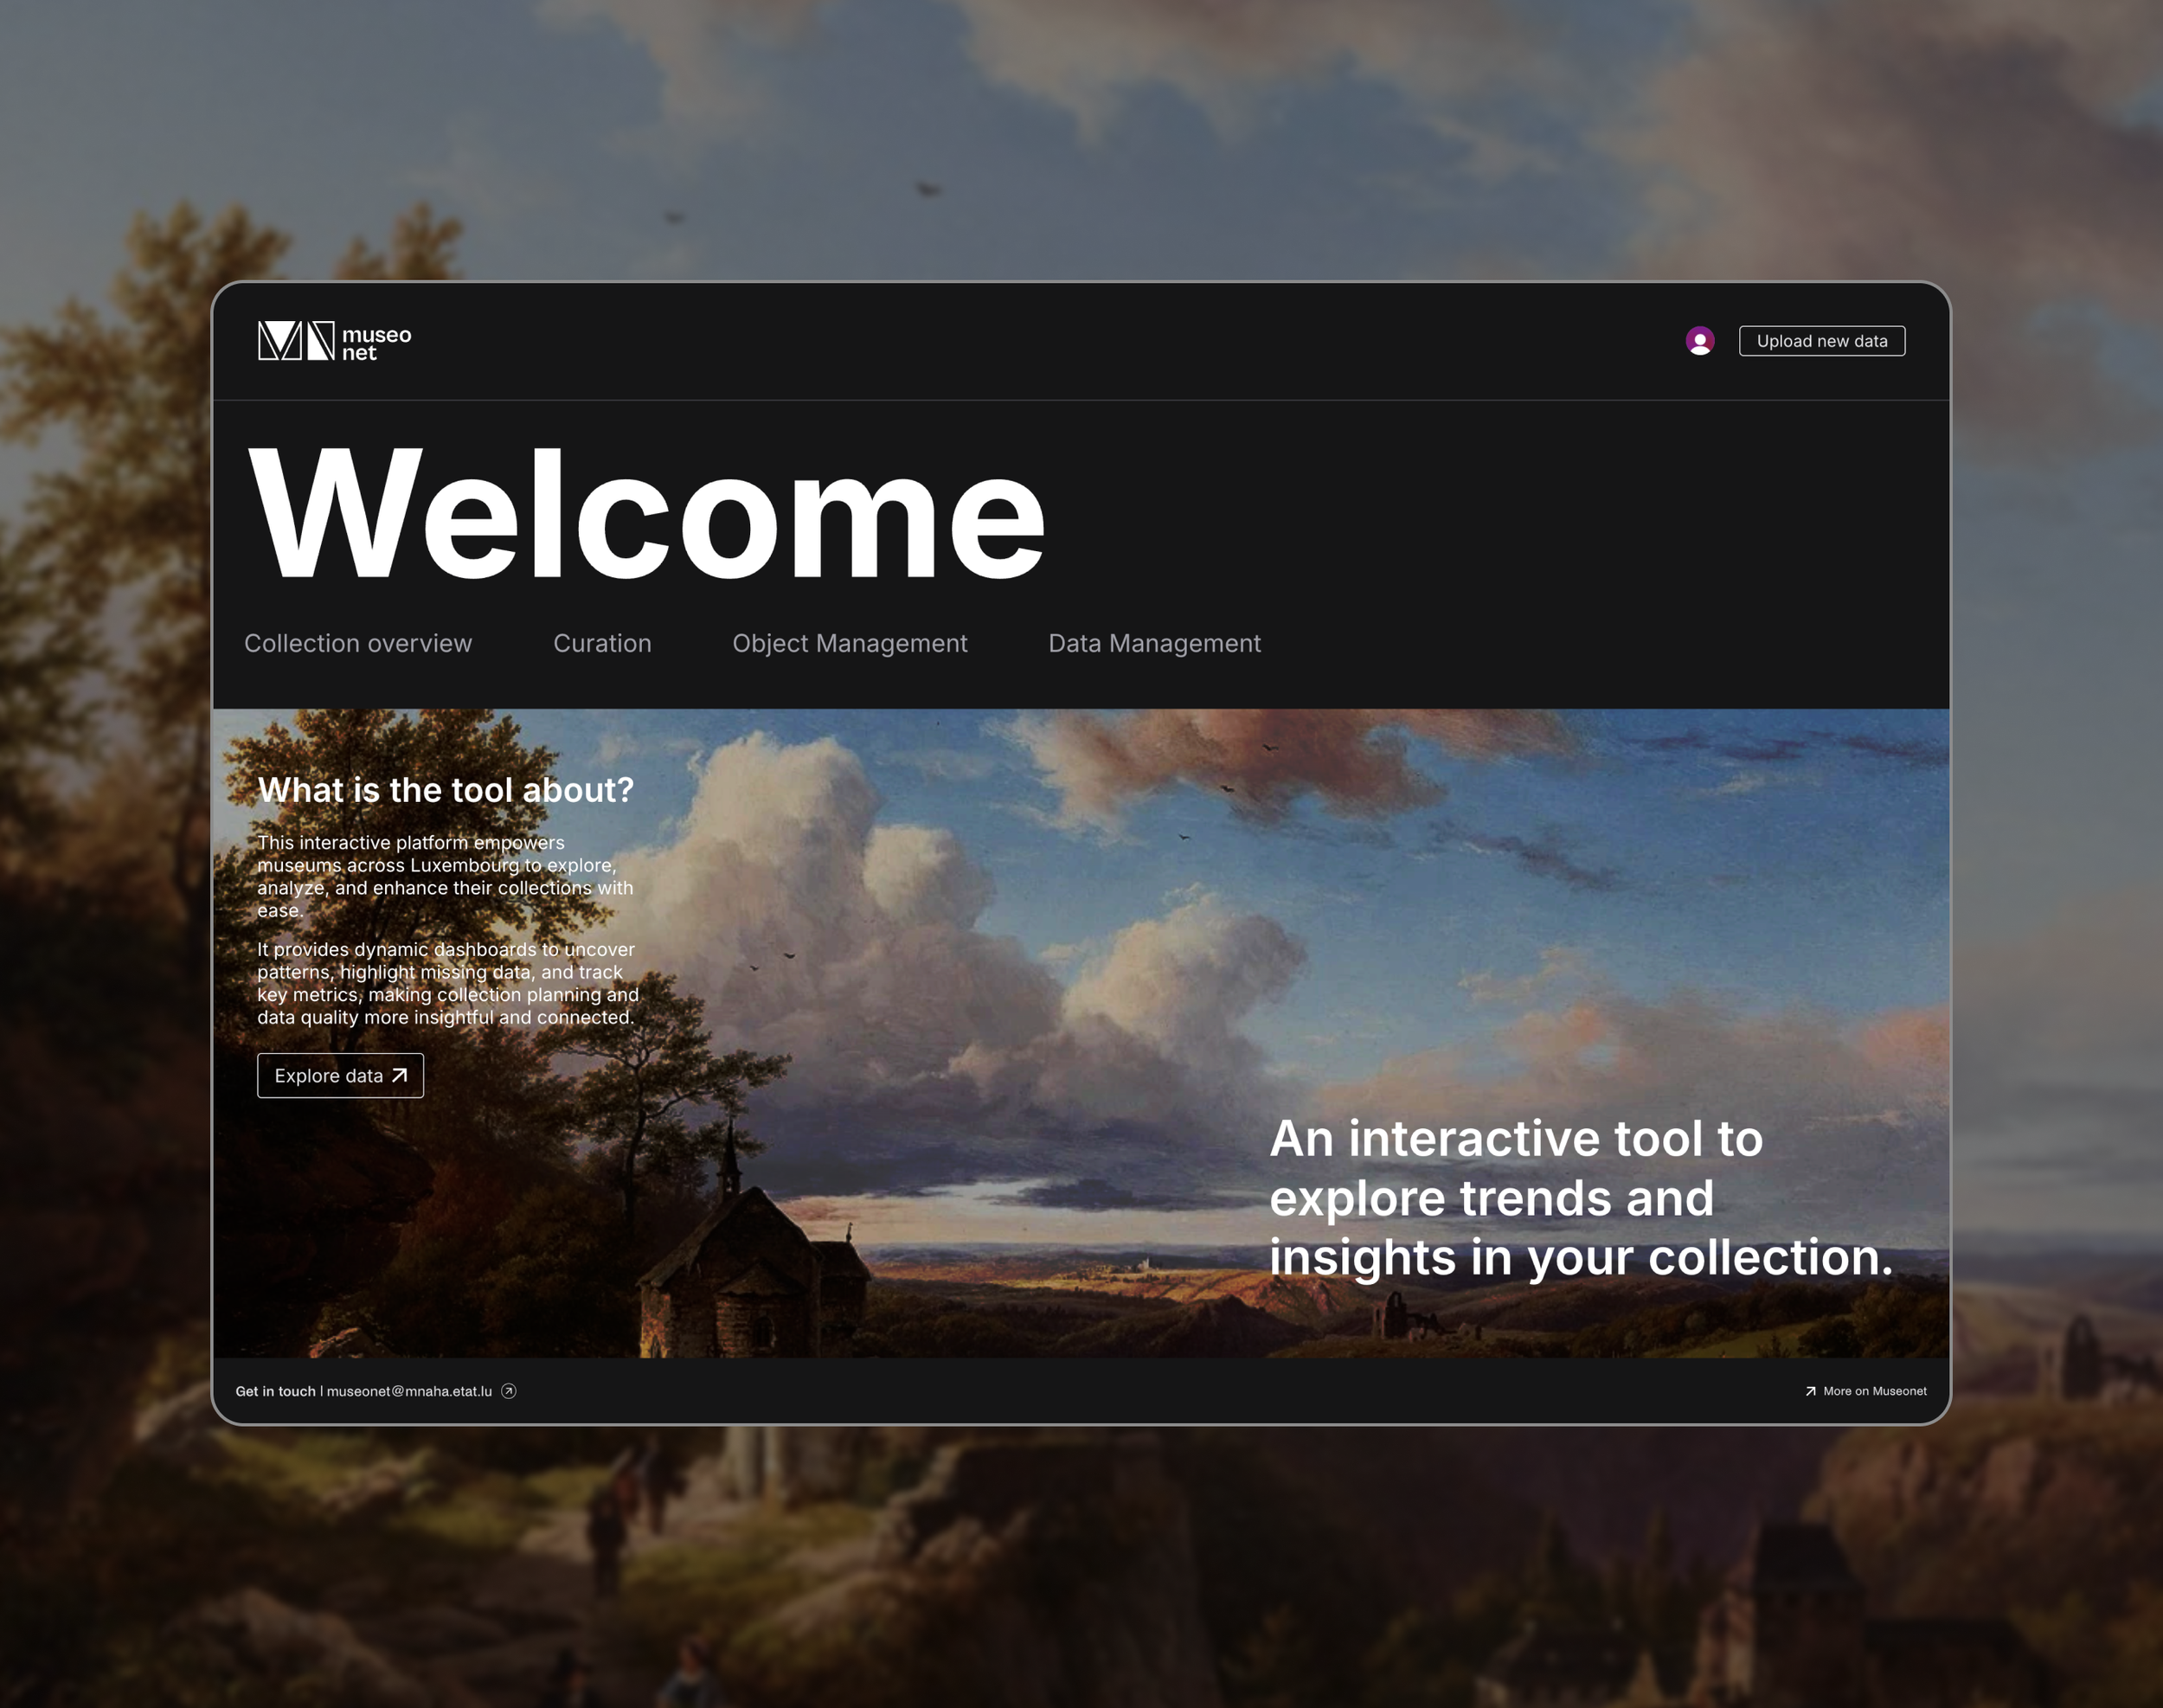
Design: Martina ZunicaIn collaboration with the Luxembourg Ministry of Culture, I co-developed a custom interactive platform designed to visualize and analyze museum collections across multiple institutions.
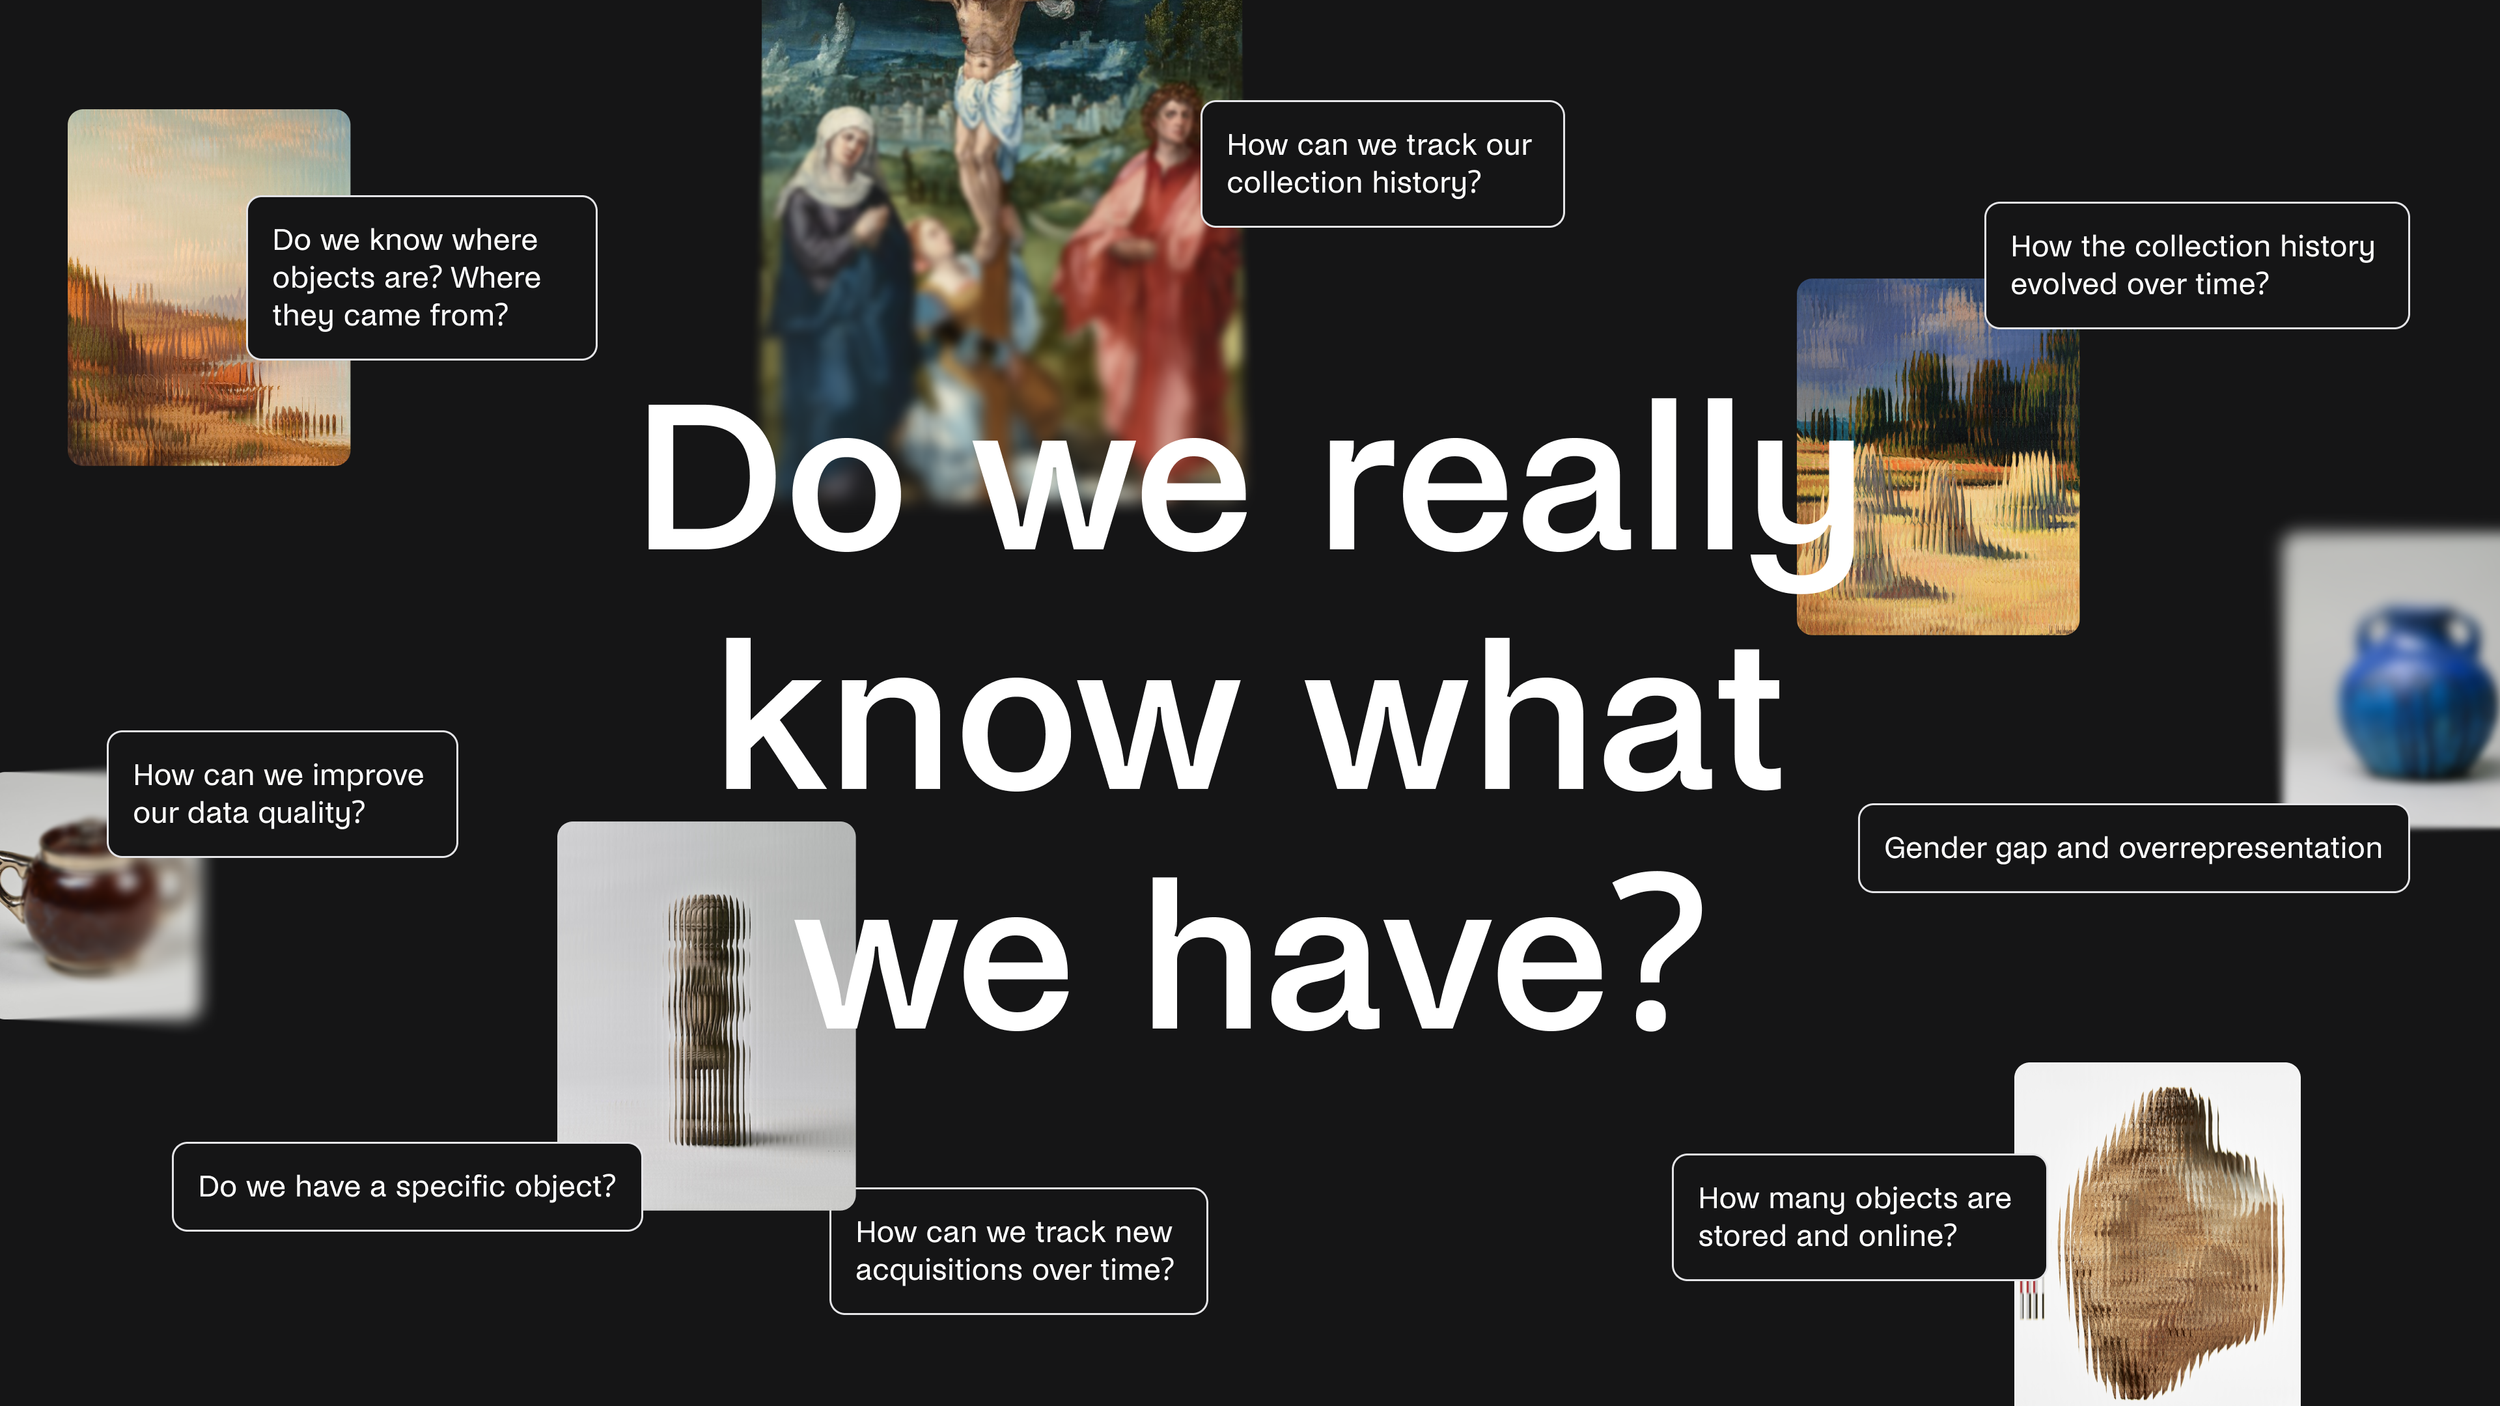
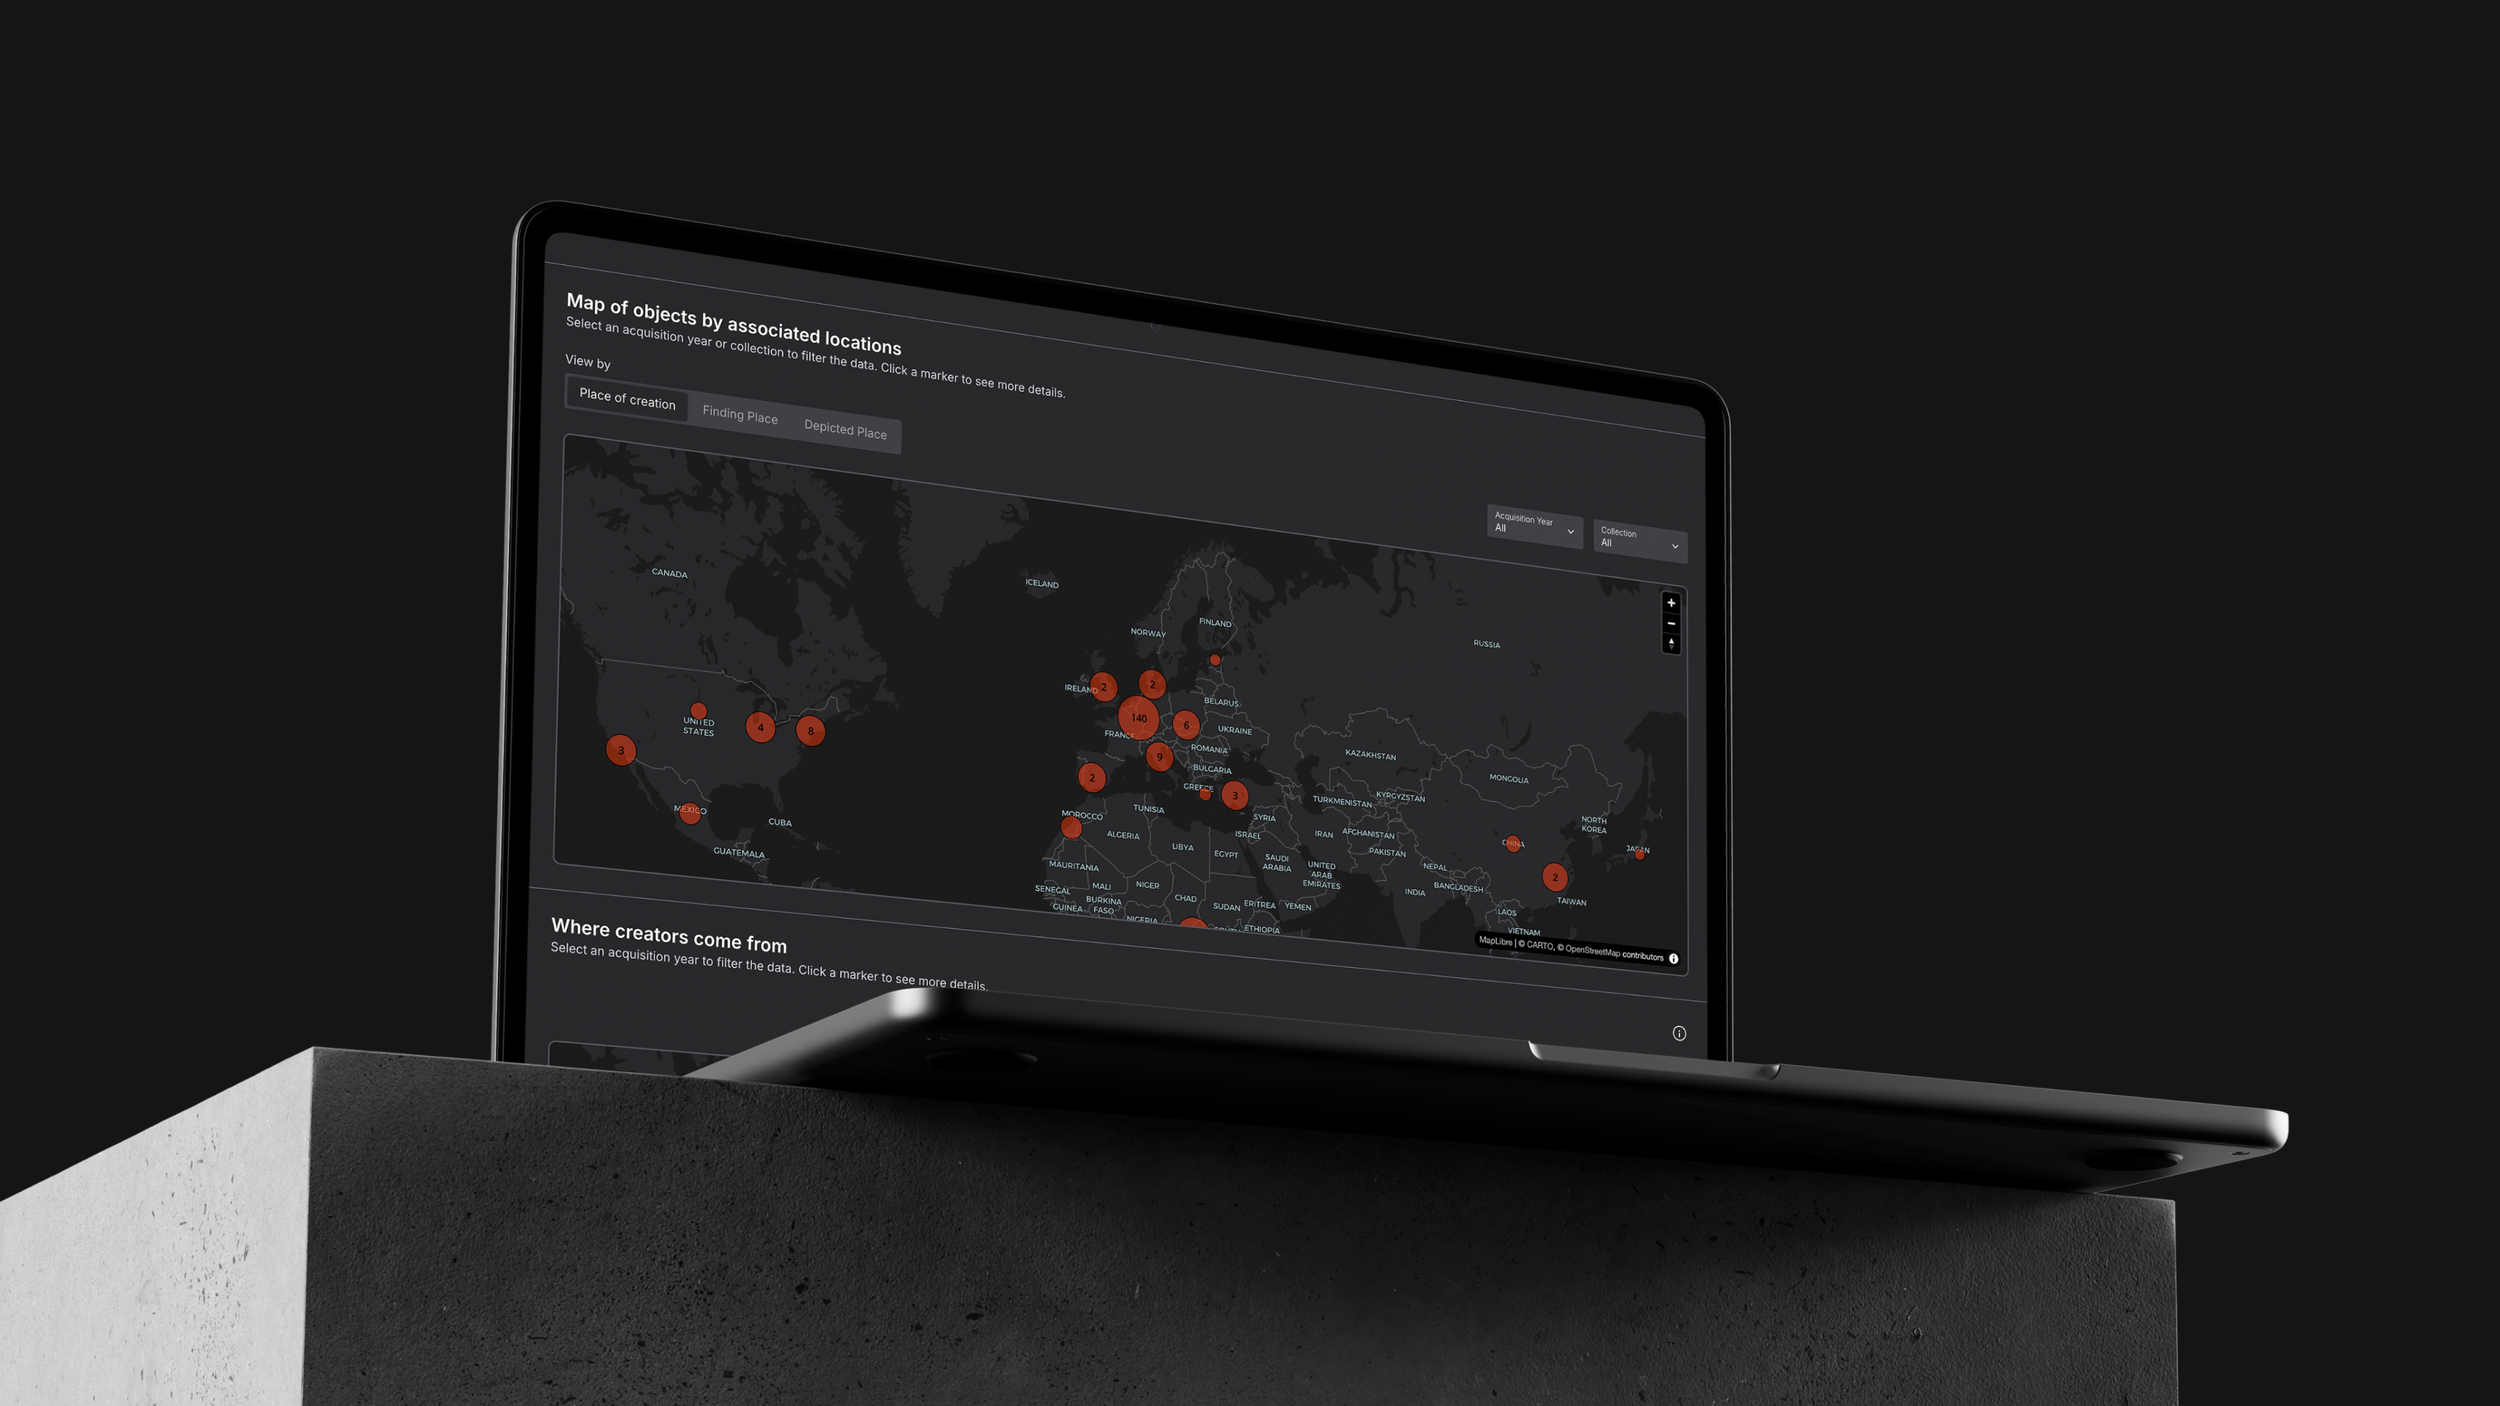
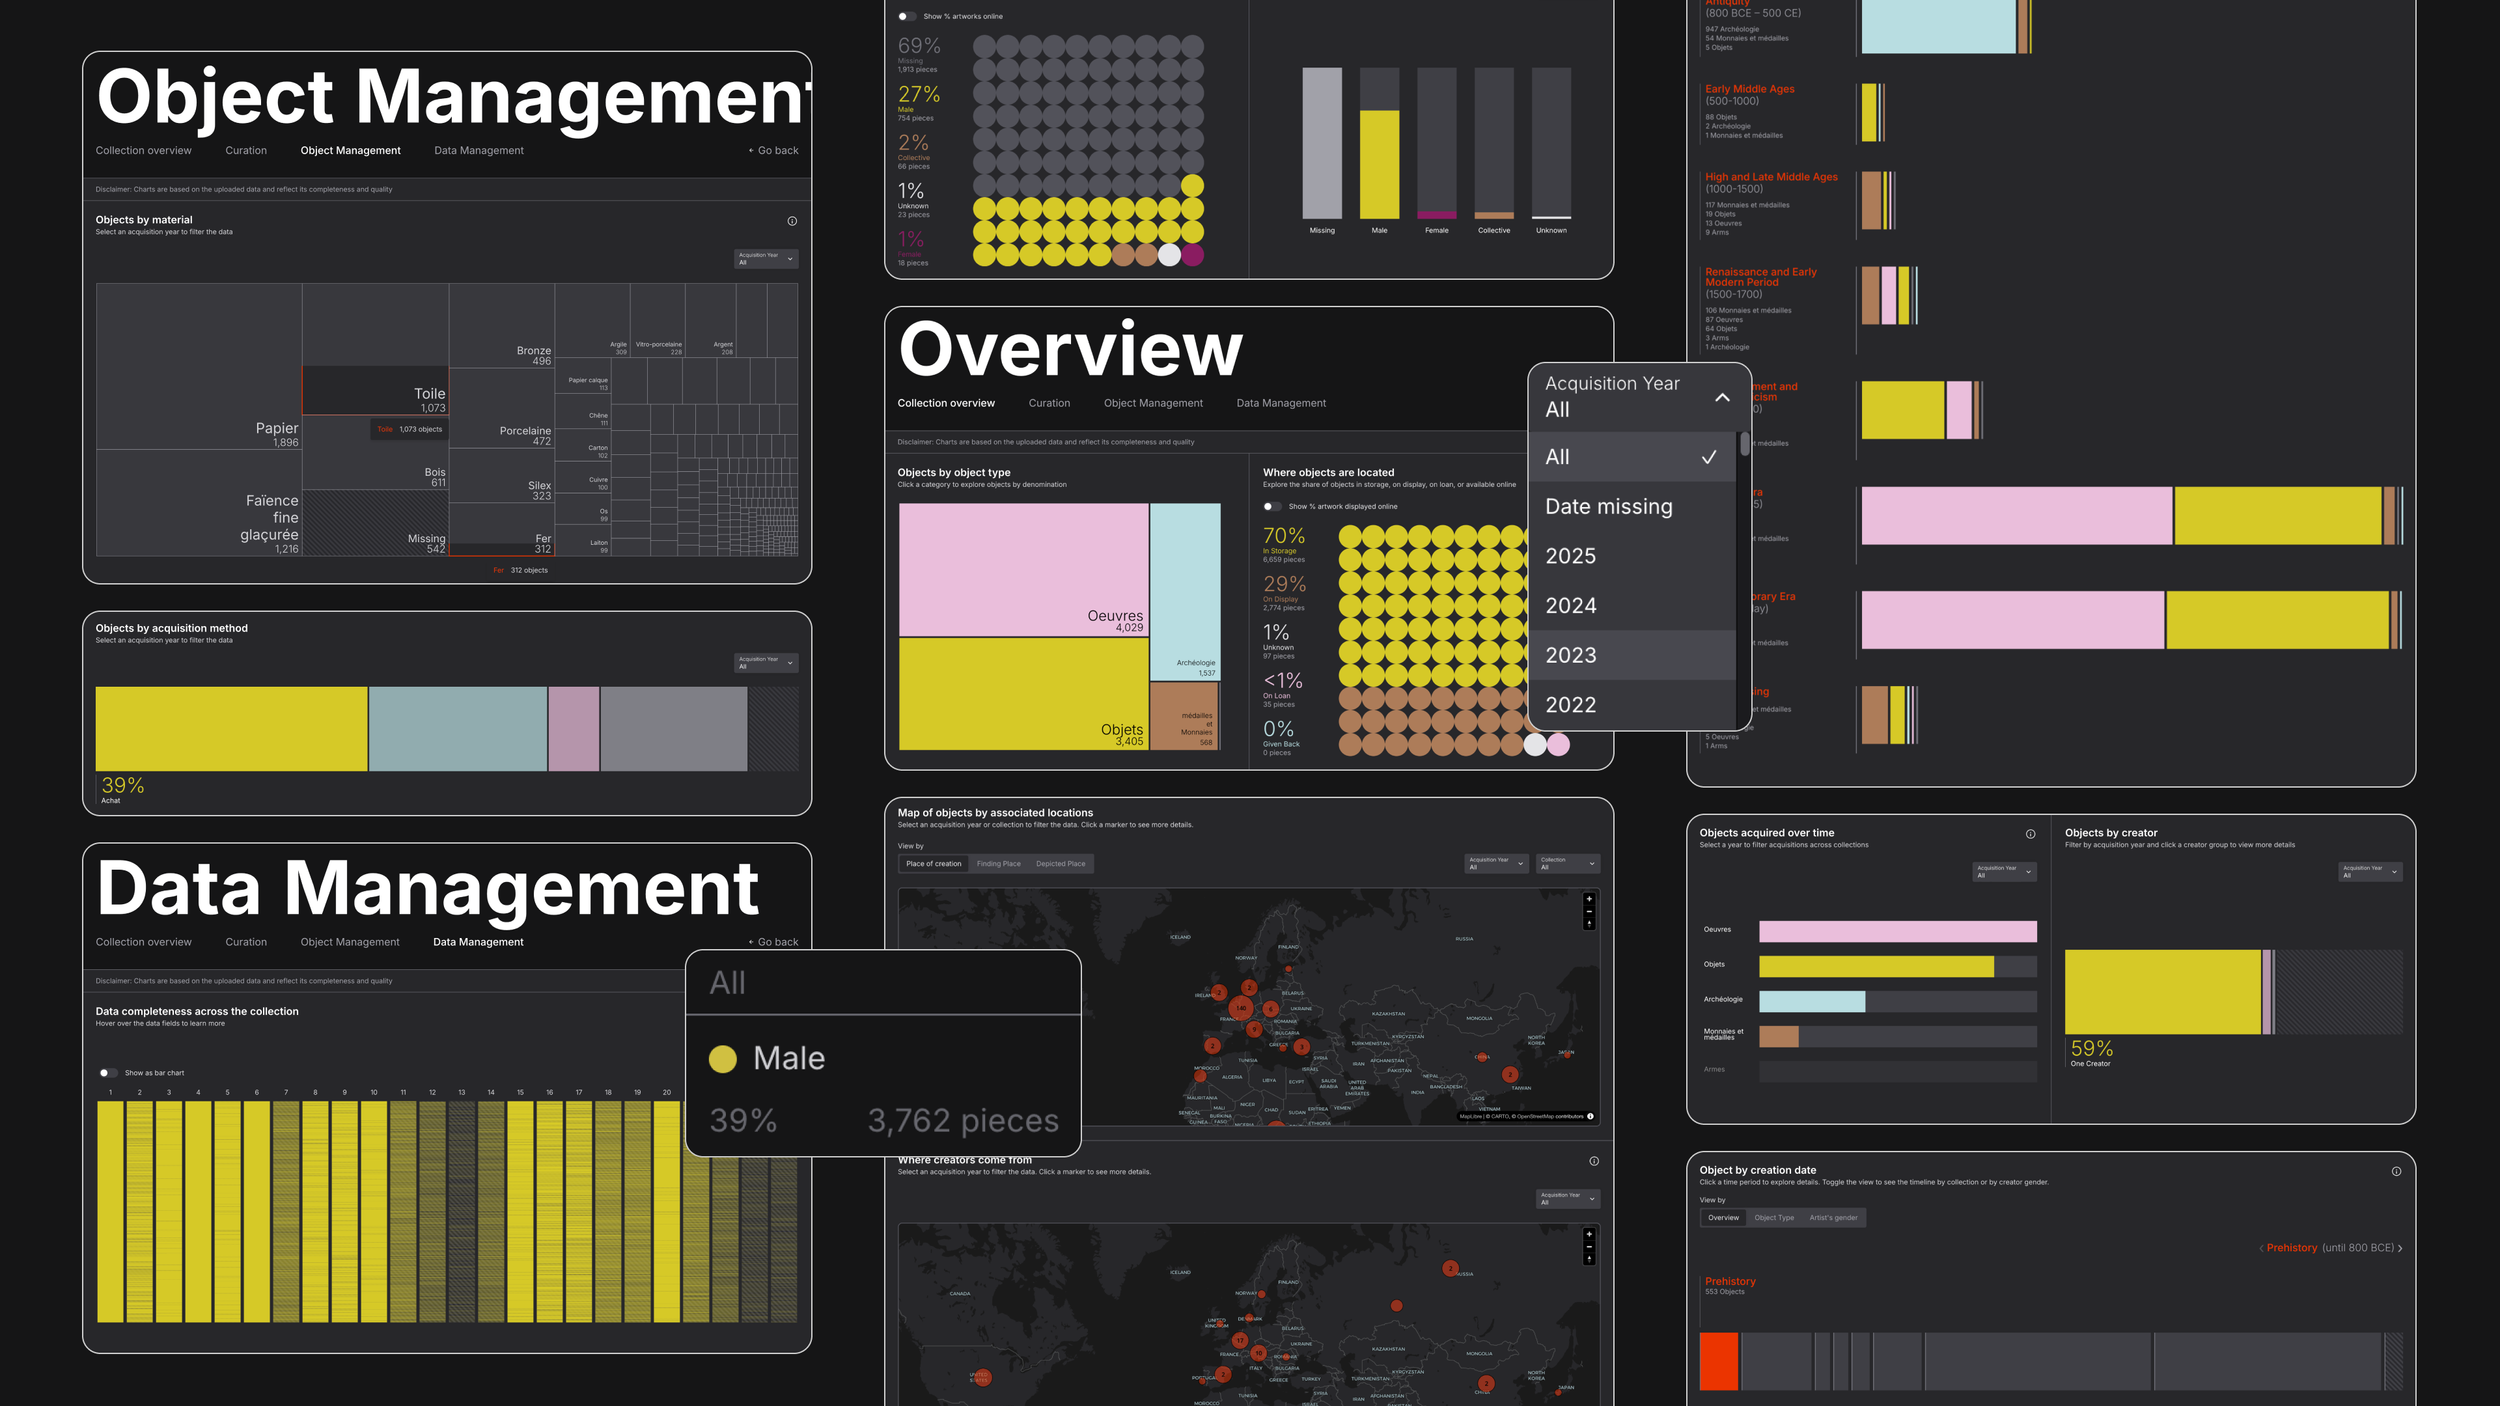
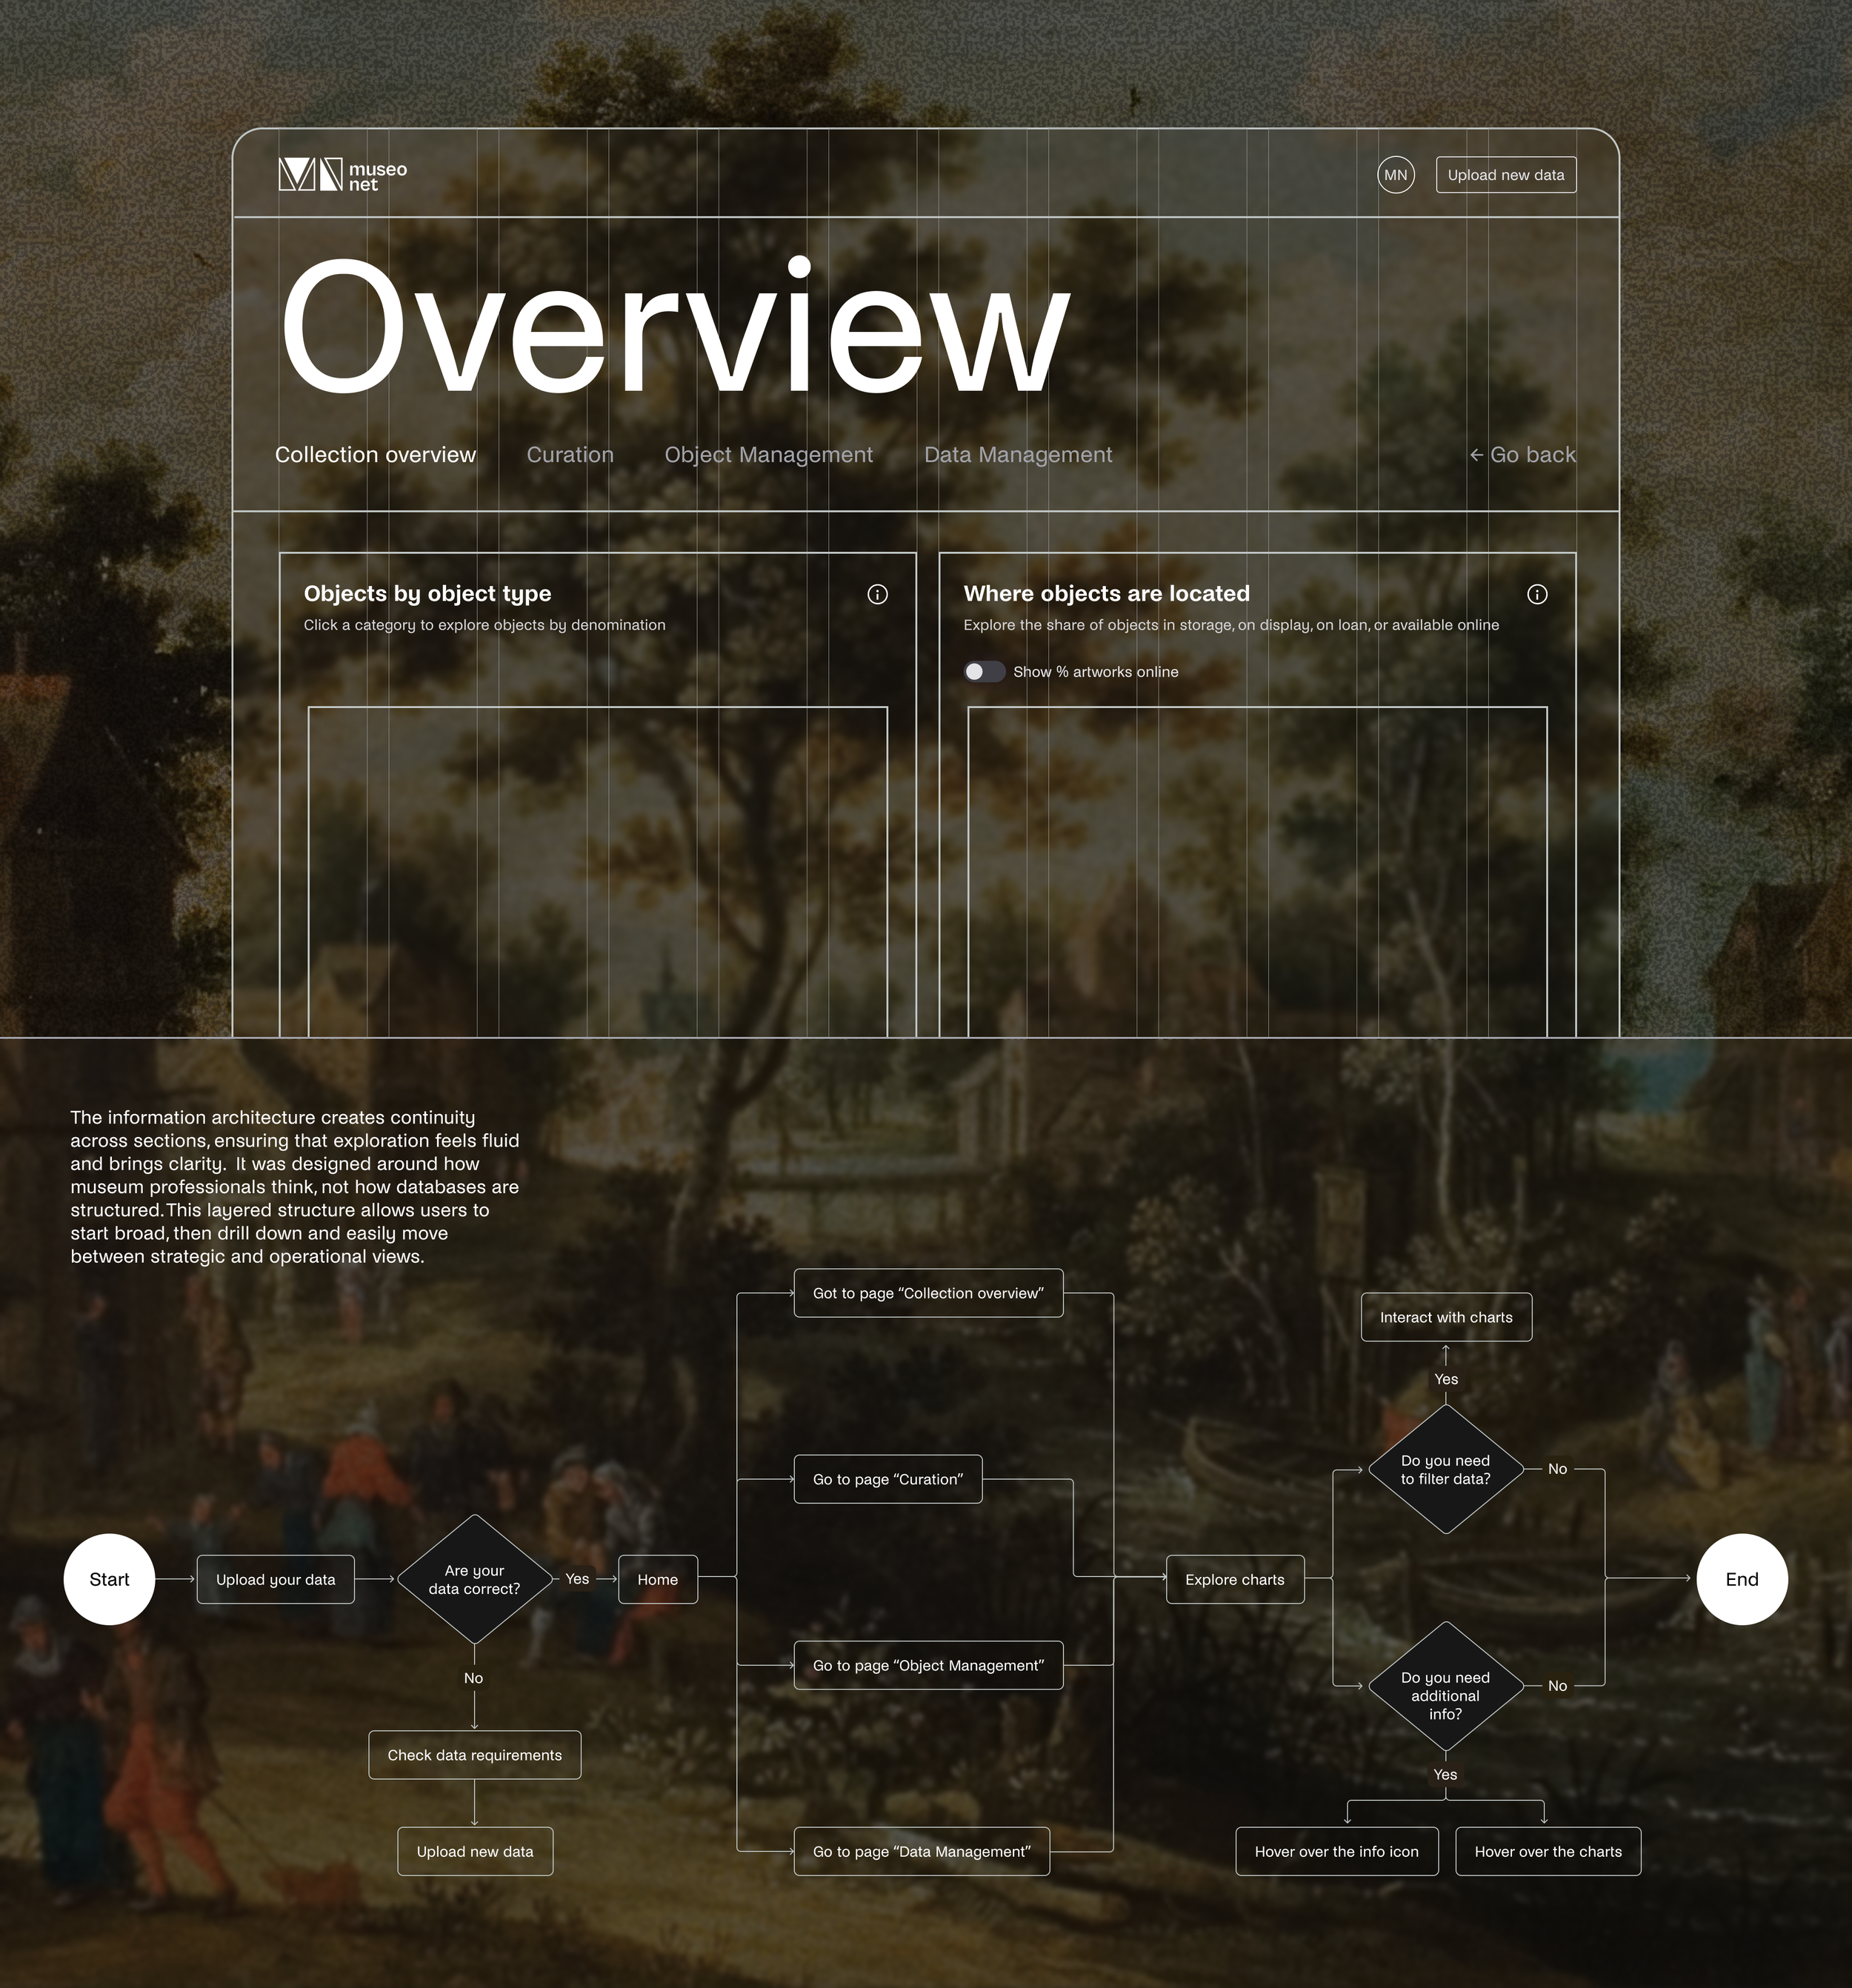
The tool transforms structured but underused collection database exports (MuseumPlus) into dynamic visual overviews. Instead of browsing one object at a time, museum staff can explore patterns across entire collections: acquisition trends, artist distributions, materials, conservation status, copyright, exhibition history, and data completeness.
This project moves museum data from passive archive to active decision-making tool. It enables curators, registrars, and collection managers to see their collections at scale — revealing patterns, gaps, and opportunities that were previously hidden in database tables.
You Are Not Alone
Exhibition
▿

Van Gogh Museum, Amsterdam 2024
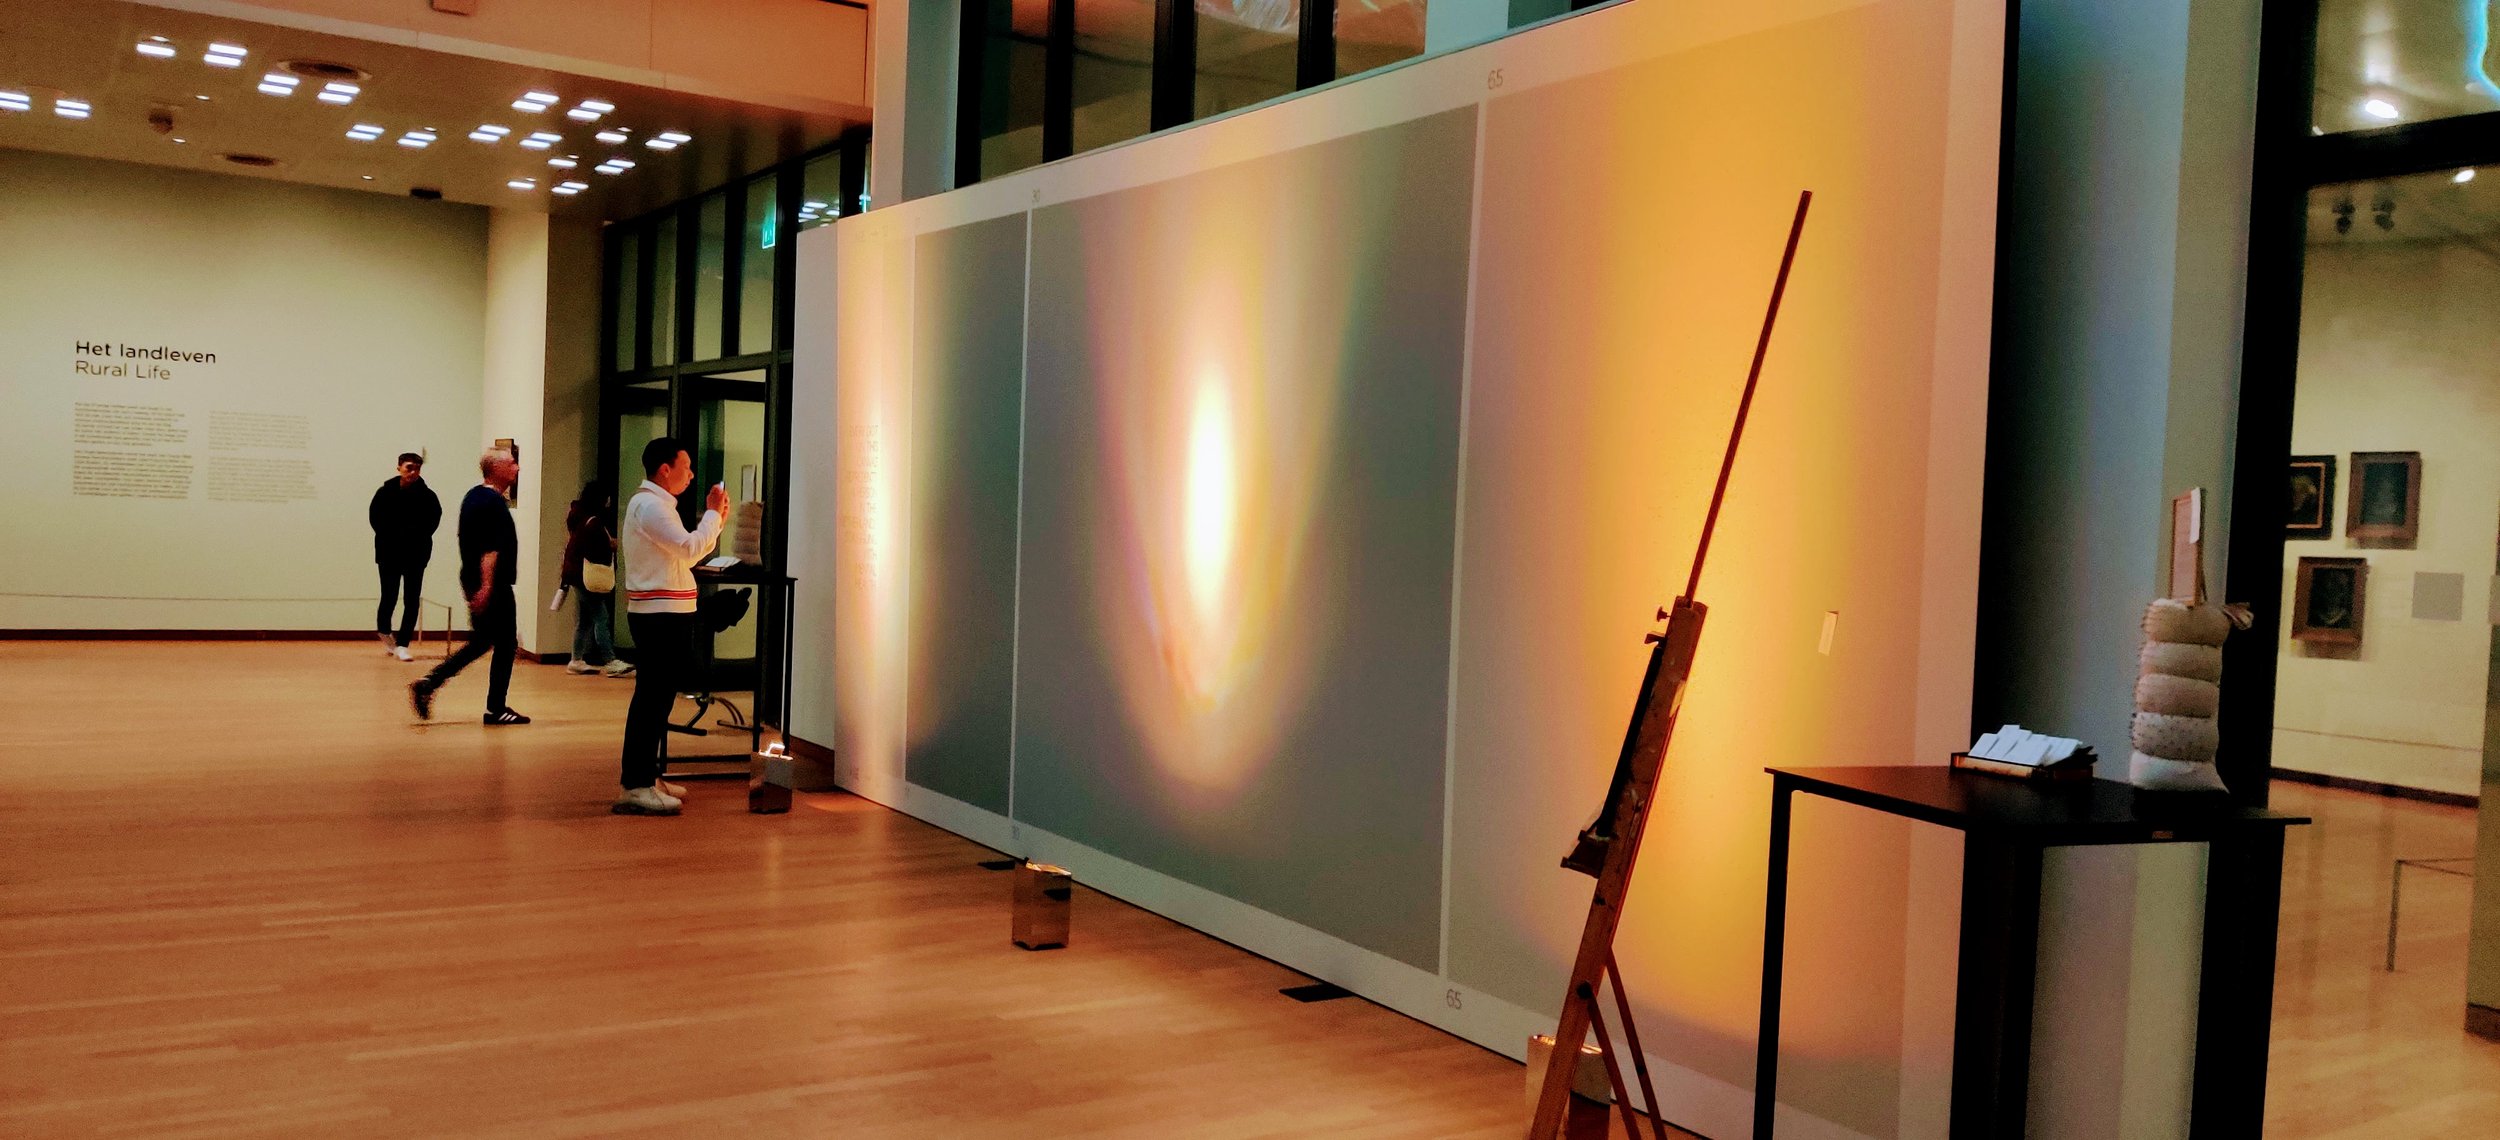
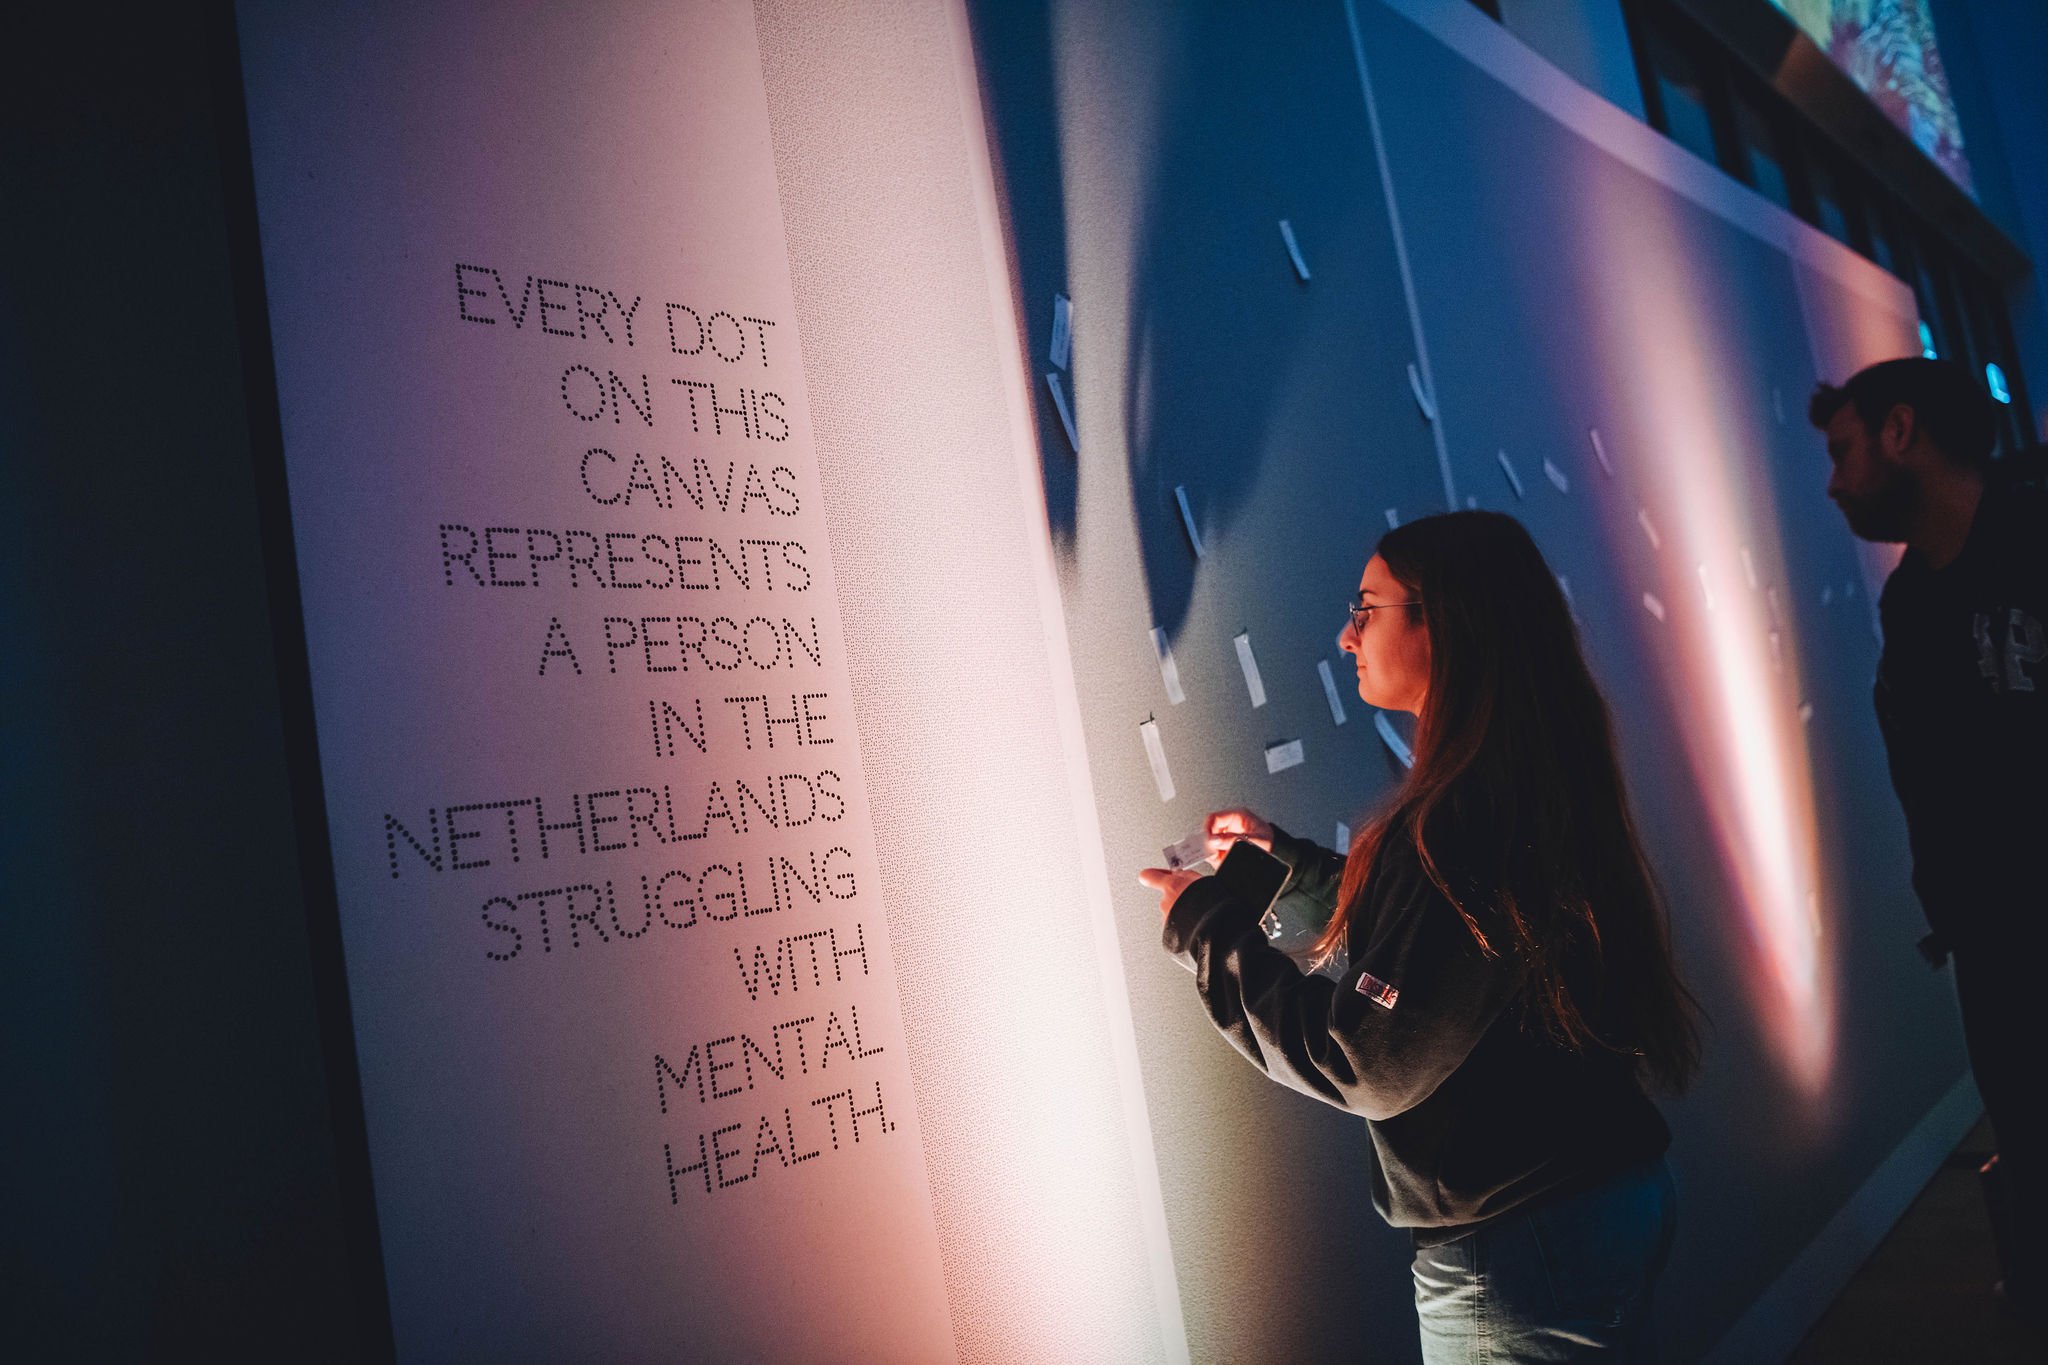
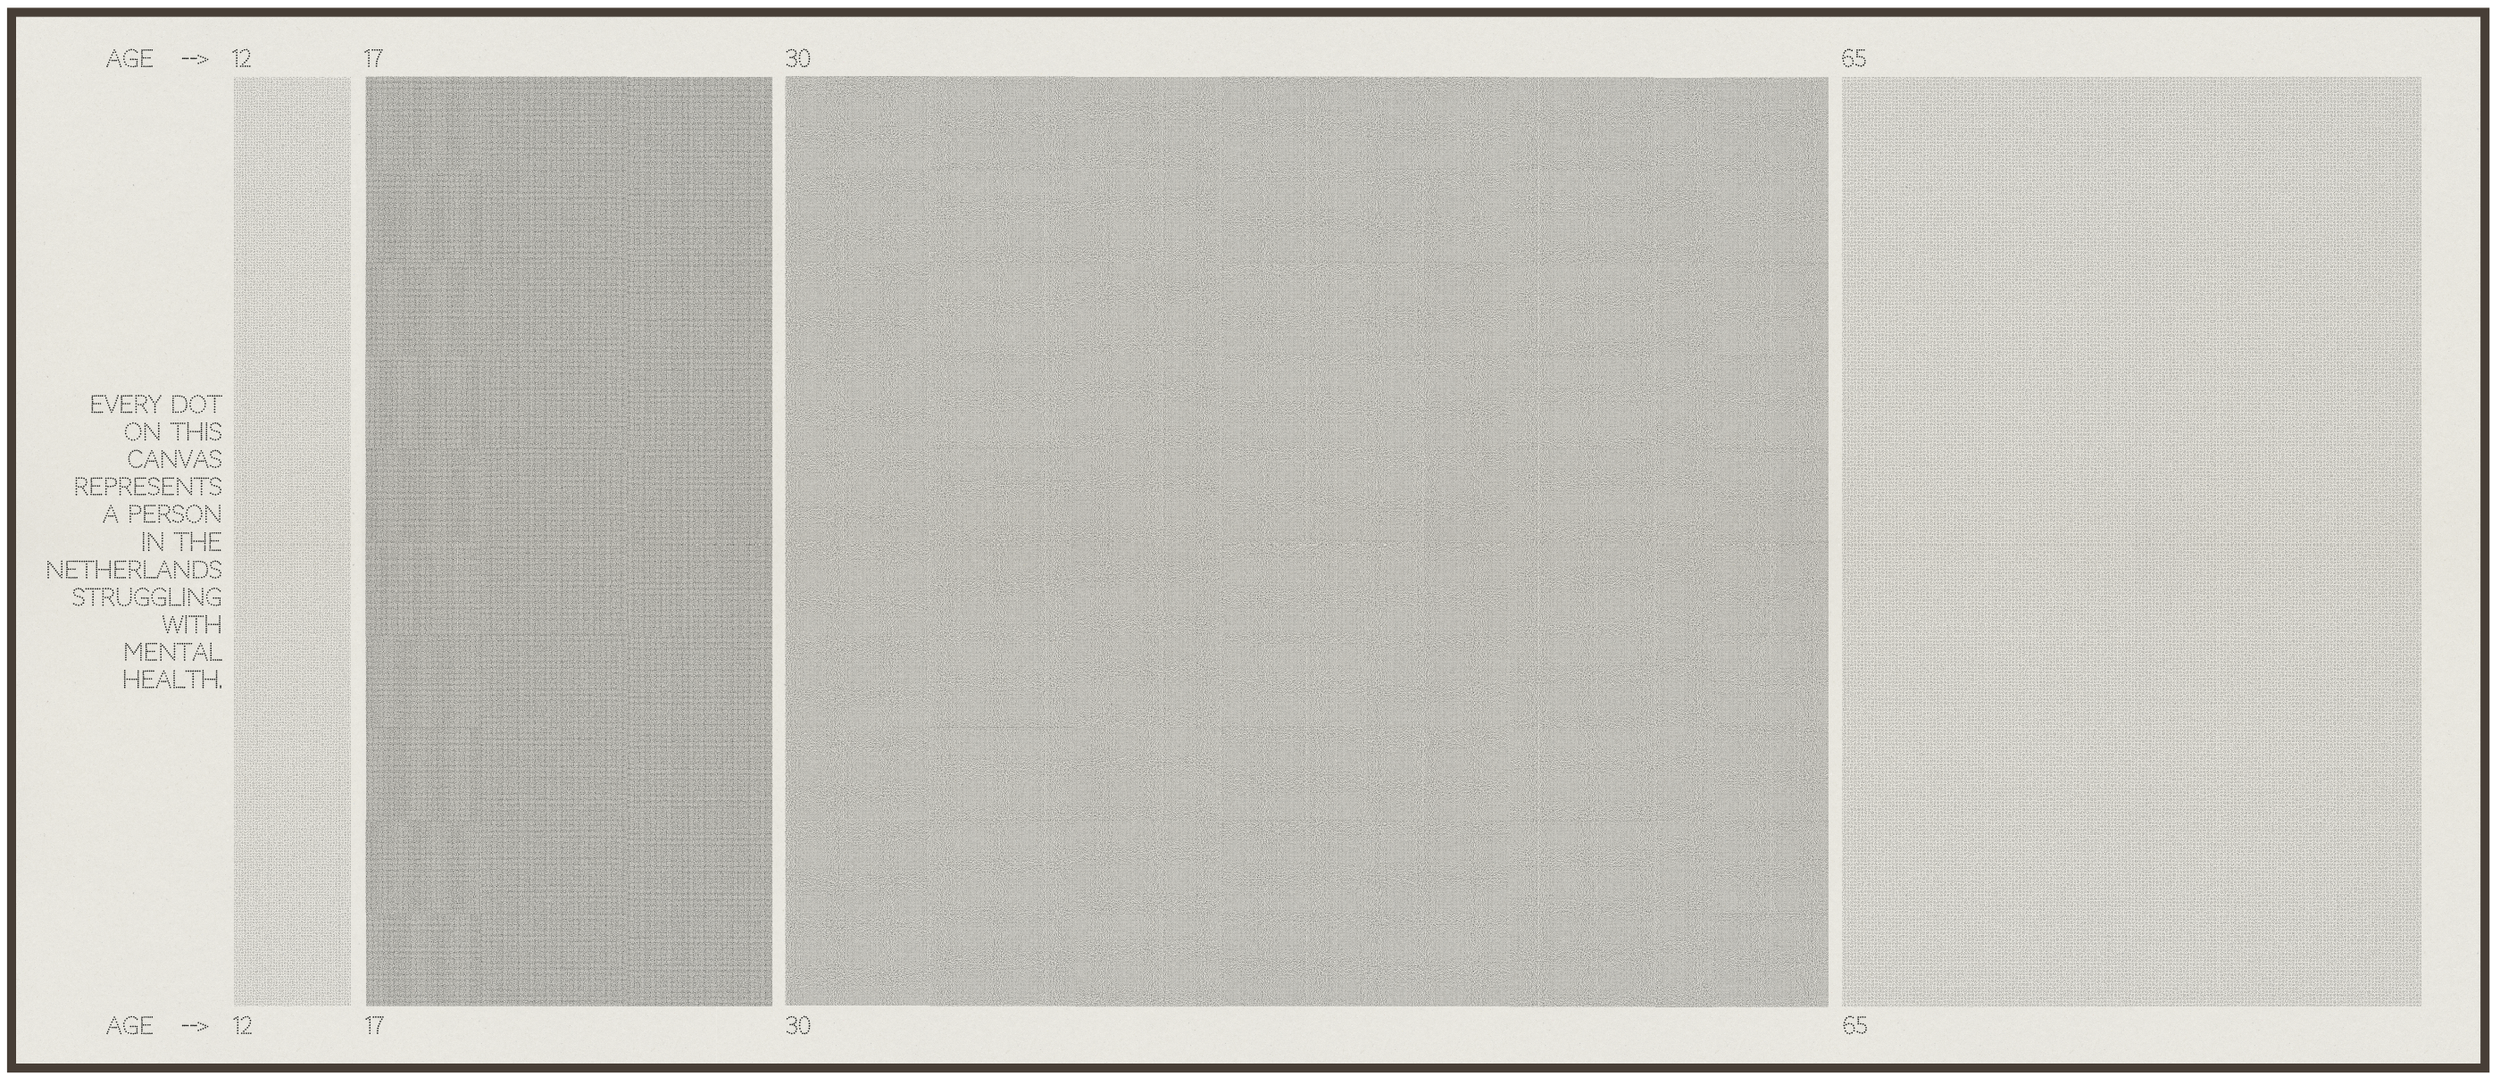
This 7-meter by 3-meter canvas holds 2.3 million dots—each representing one person in the Netherlands struggling with mental health. The sheer number of dots, organized by age groups, illustrates that mental health challenges affect all generations, though the overrepresentation of young adults is particularly striking.
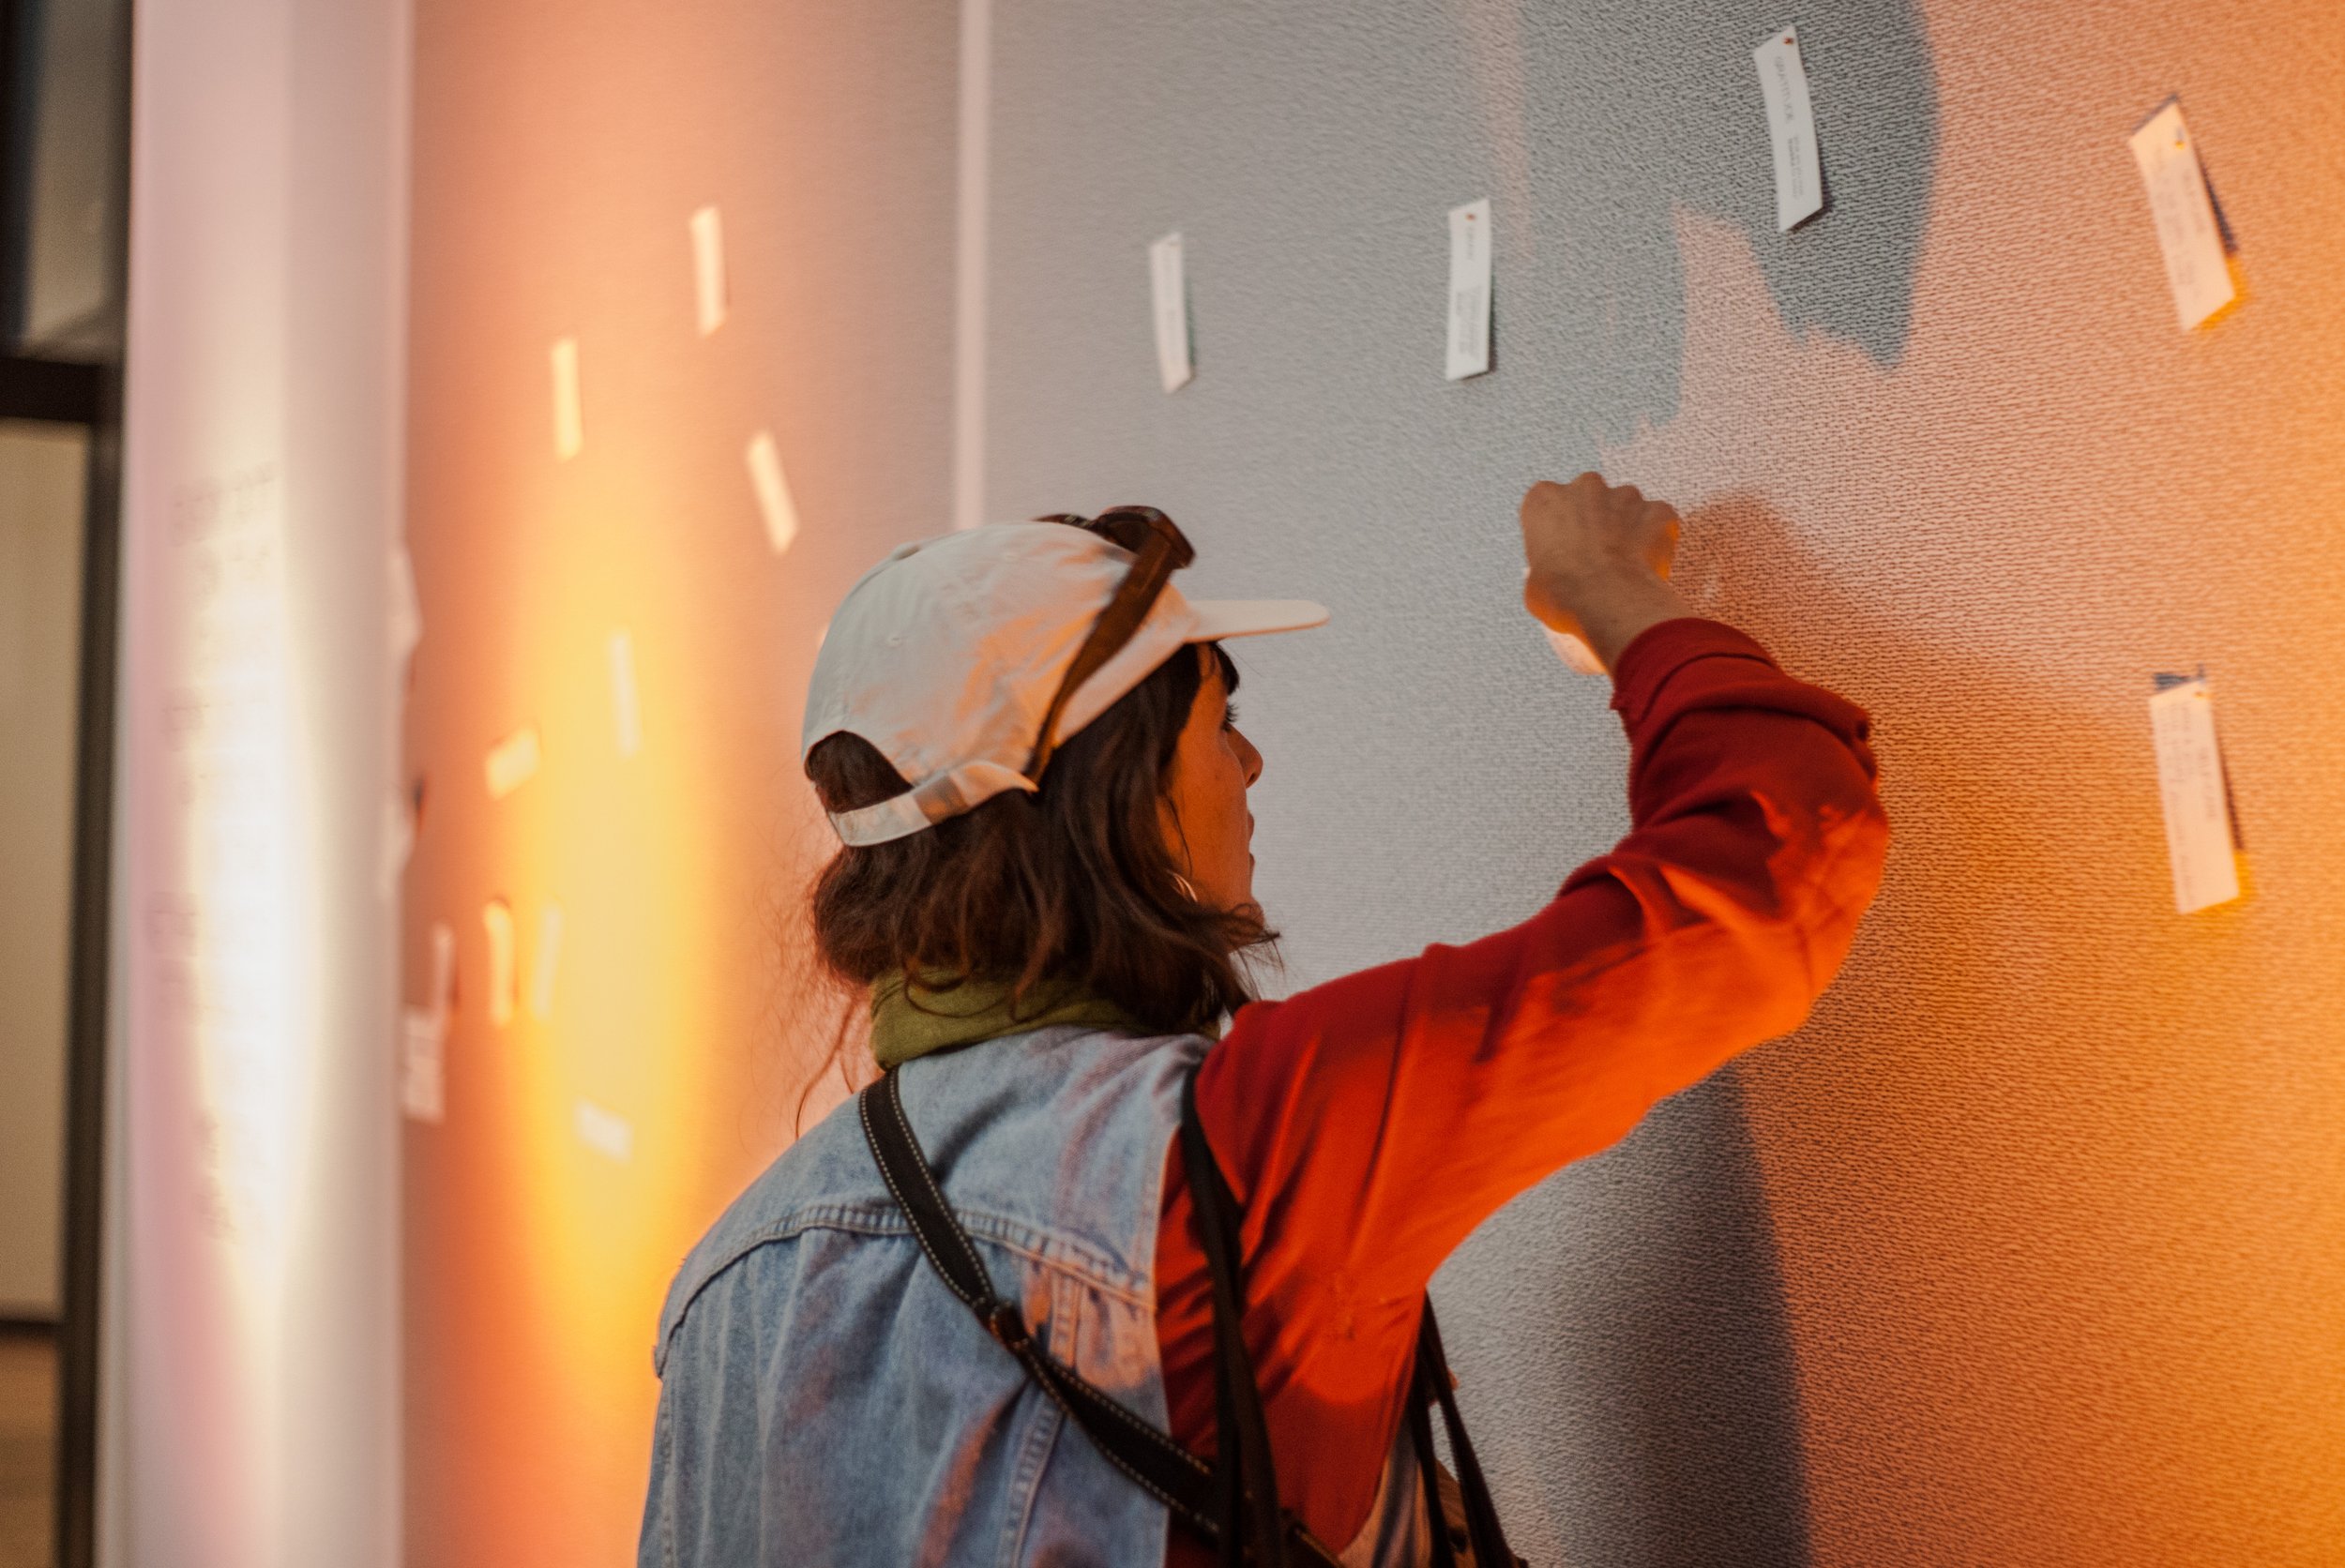
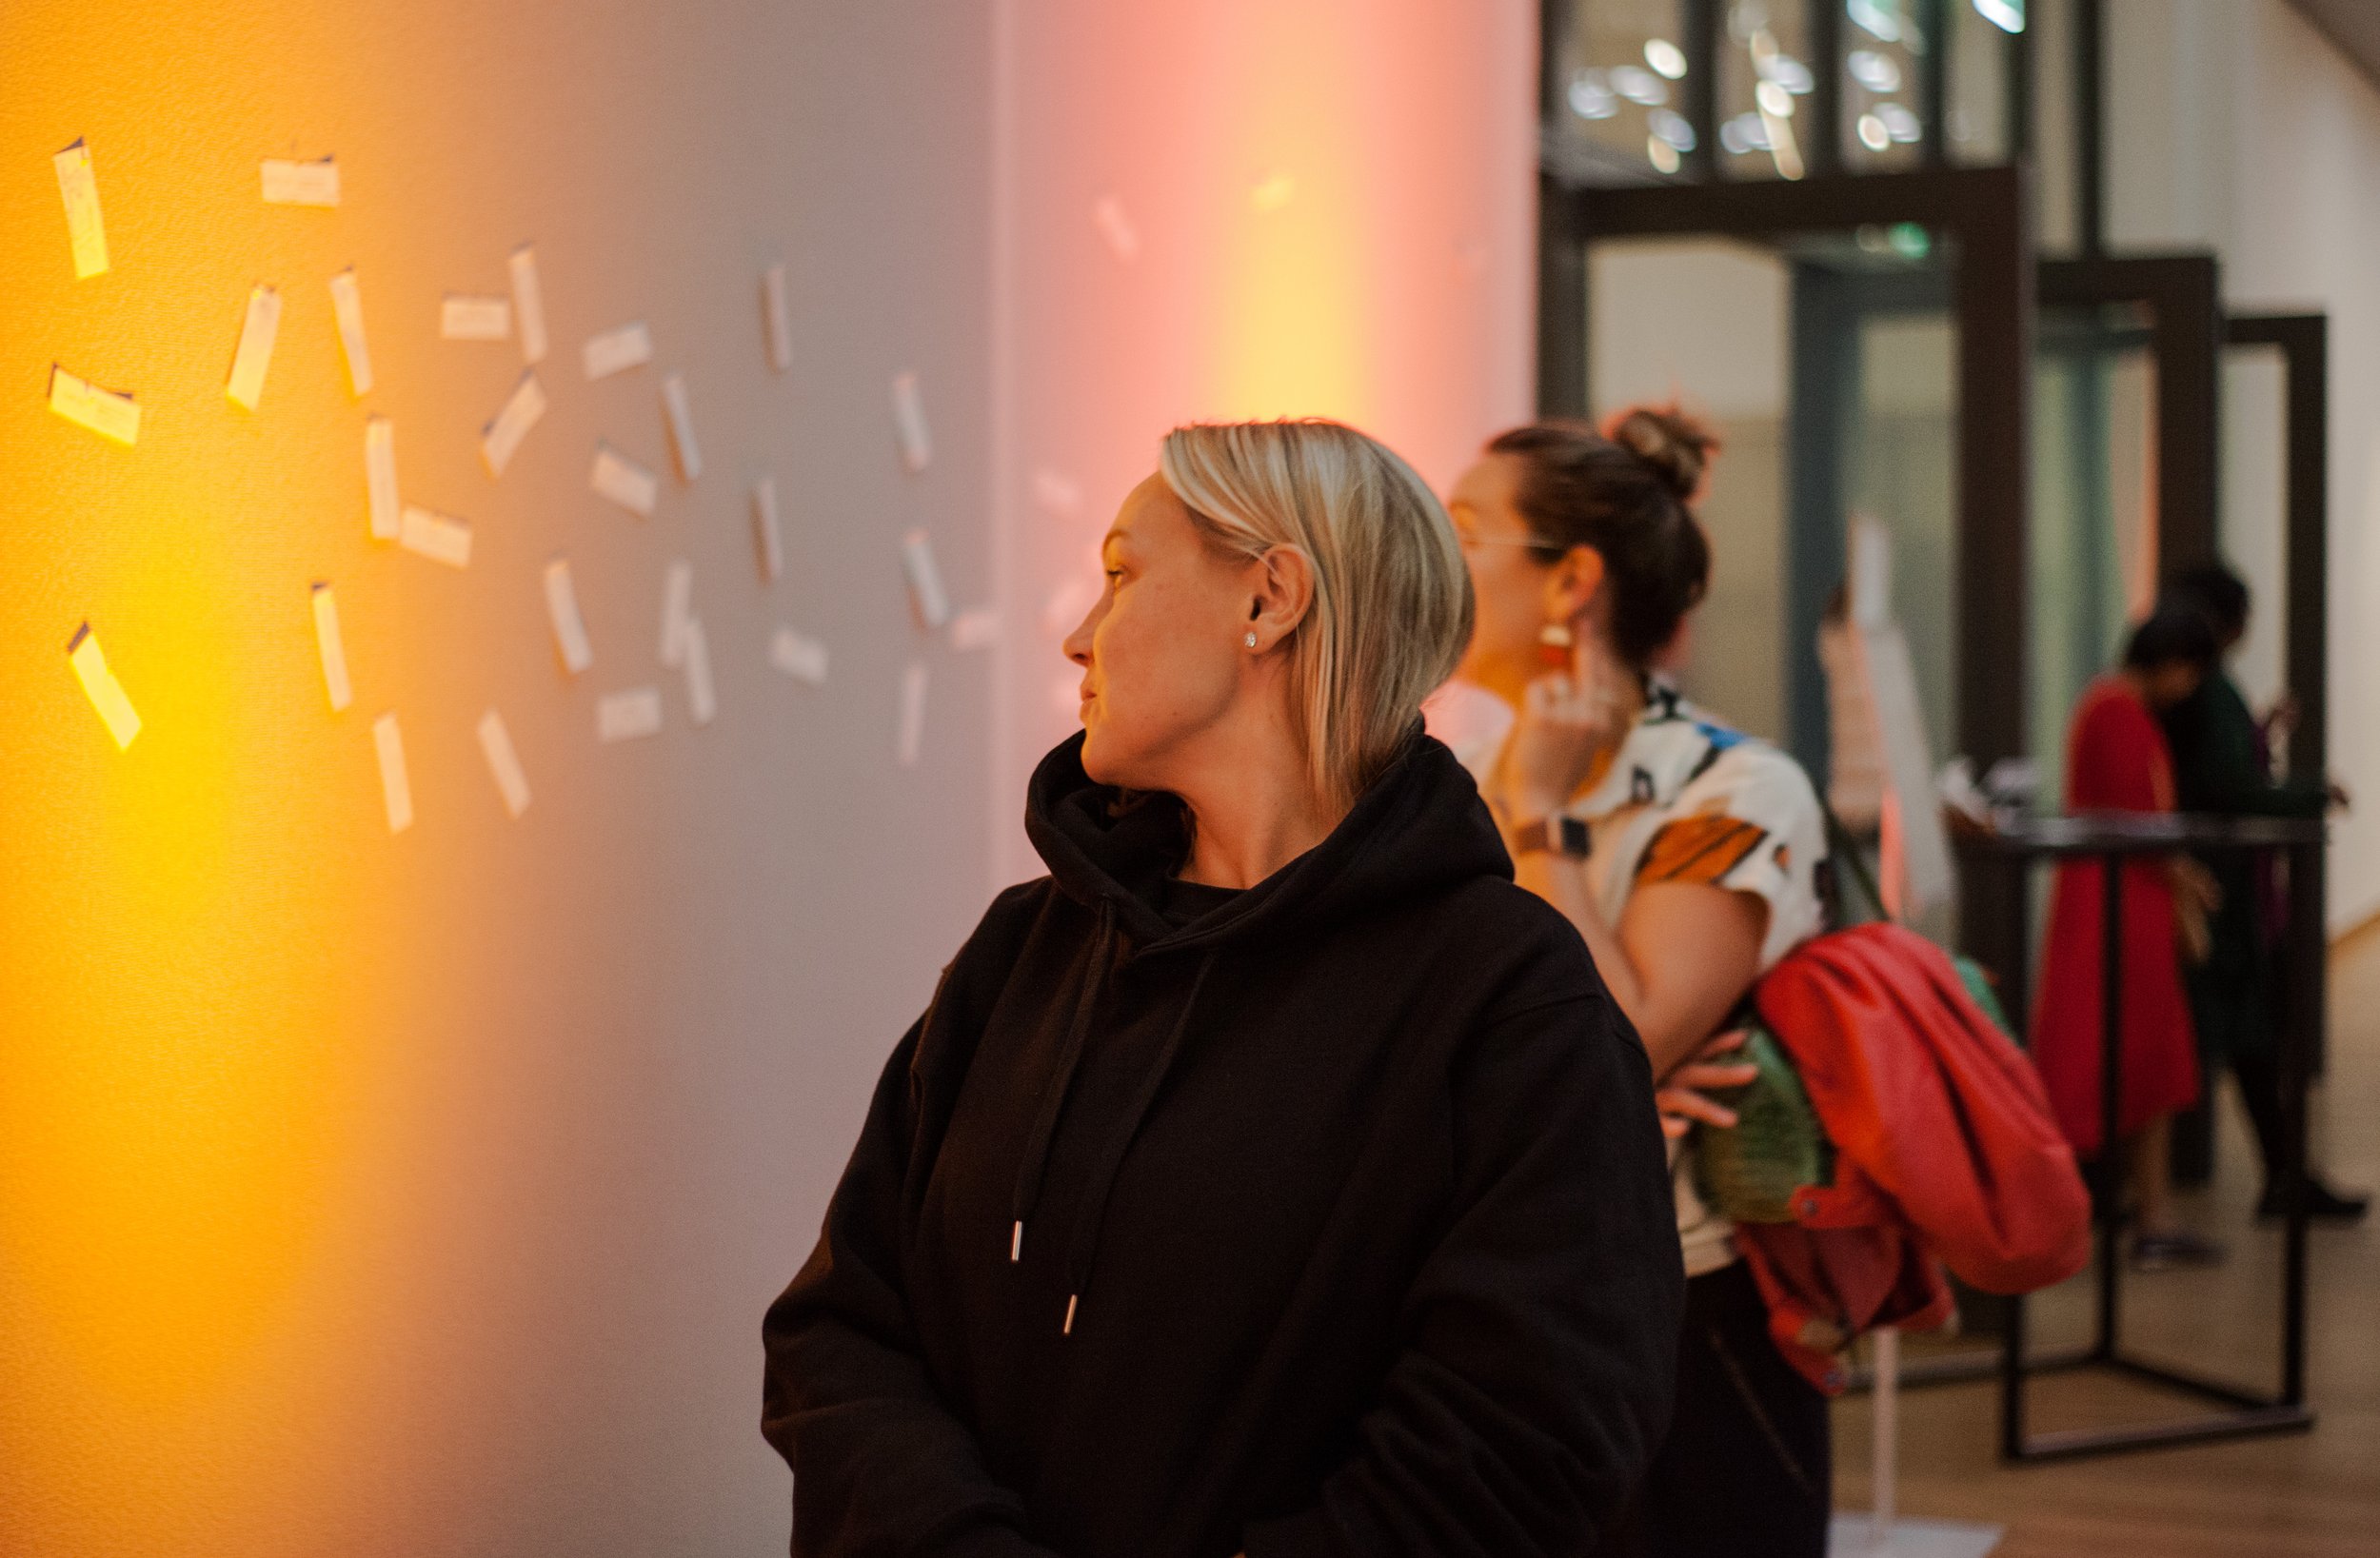
From a distance, the dots blend into a seemingly uniform mass. But as you step closer, the overwhelming quantity and detail become disorienting, a reflection of the enormity of the issue. While data visualizations often reduce individuals to mere statistics, I wanted to humanize the experience. Visitors were invited to interact with the artwork by adding gold pins and personal notes—messages of support, shared experiences, or drawings—transforming the canvas from cold data into a living, evolving piece of art.
By the end of the evening, the canvas had evolved into a powerful expression of solidarity, filled with hundreds of heartfelt notes that personalized the dots. Conversations sparked among strangers, turning the visualization into a space for empathy and connection. This project was a testament to the emotional power of data visualization, showing how art can raise awareness, start discussions, and break taboos, especially when presented in a physical, interactive format.
Click here to read Kathryn Reese’s blog post on the art installation


Van Gogh’s Virtual Gallery
▿

This interactive gallery showcases Vincent van Gogh’s oil paintings, allowing users to explore his works in an entirely new way. Through the use of filters, viewers can uncover surprising patterns and insights across his body of work. Each painting is clickable, providing more in-depth information about its history, techniques, and context.
2024